The datasets, tested
against real prices.
What happens after the signal? These studies show where Alphanume data maps to forward returns, changes in volatility, and larger price moves.
The signal. What followed.
- 01
Pre-Market Drop Risk
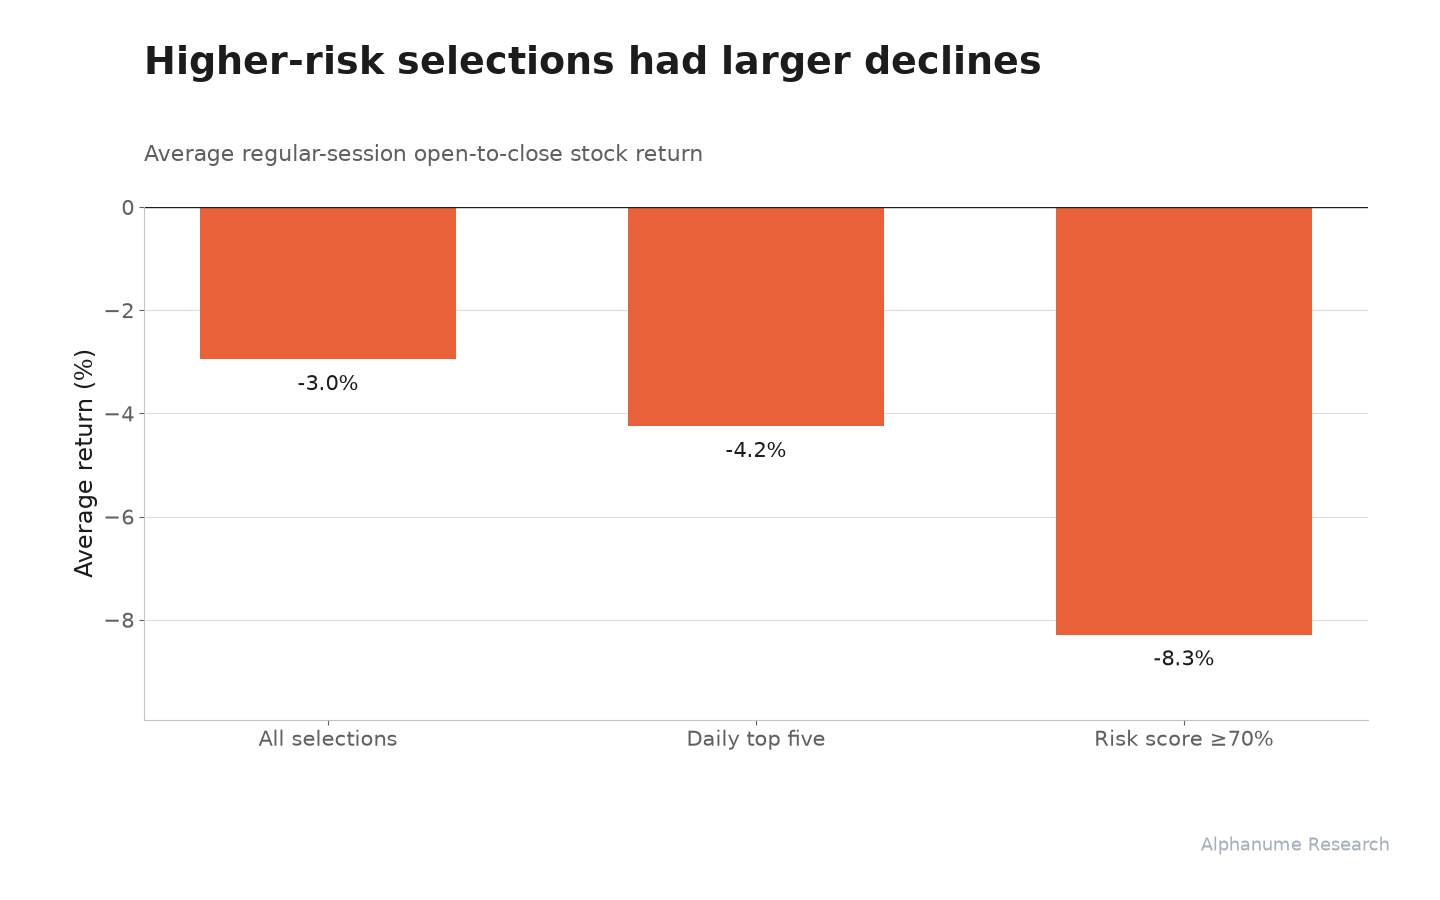
Names scoring at least 70% risk averaged -8.3% from open to close (t = -4.3); 76% closed lower.
Forward returns - 02
Toxic Financing
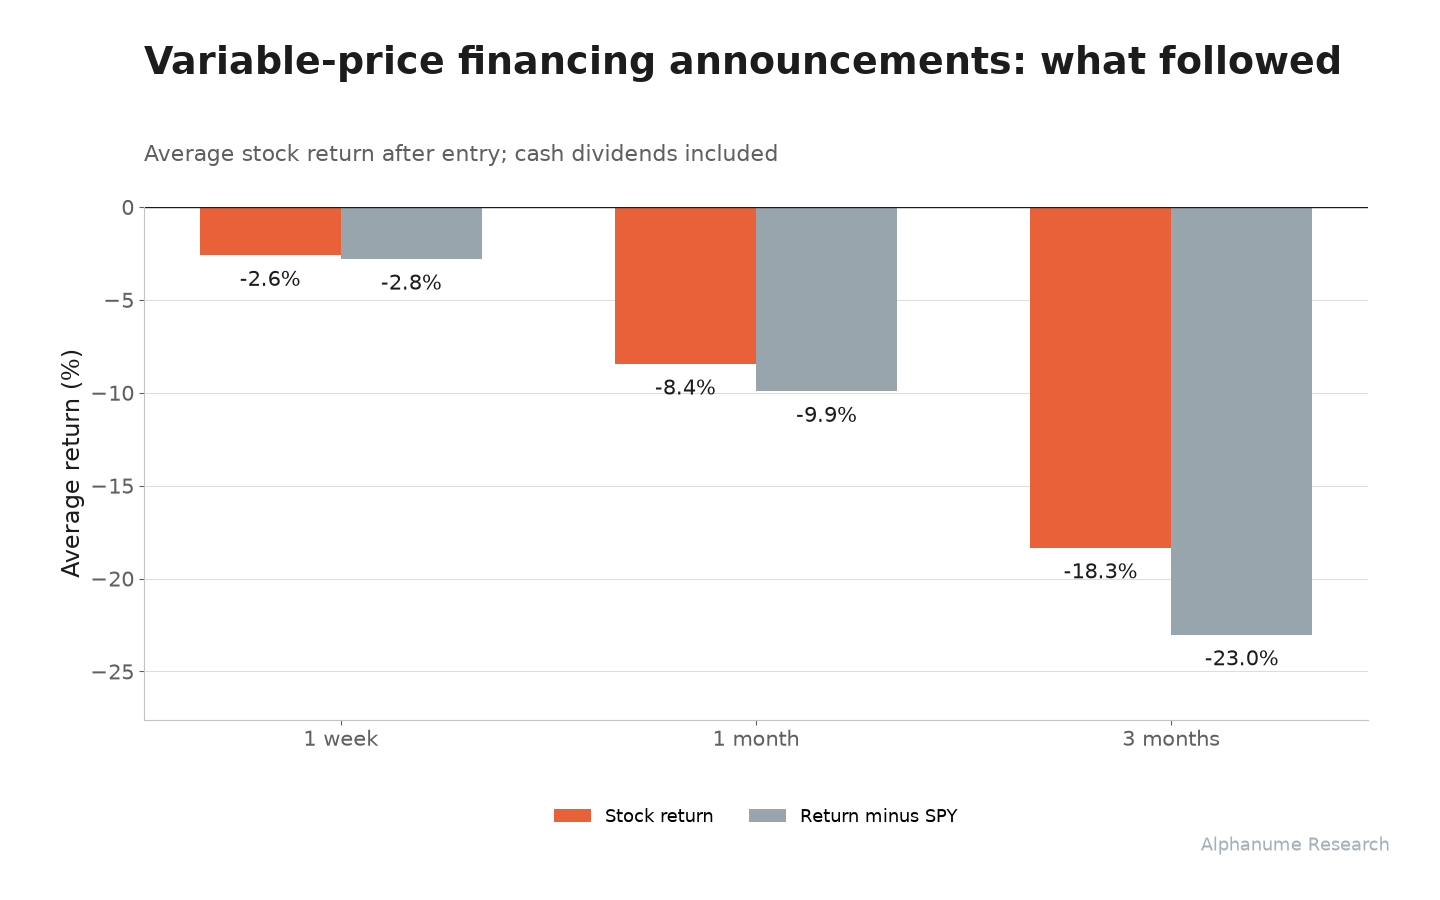
Variable-price financing announcements: average 1-month return of -8.4% (t = -2.4). 70% of stocks finished lower.
Forward returns - 03
Enriched Reverse Splits
Reverse splits of 1-for-10 or larger: average 1-month return of -9.4% (t = -4.0). 69% of stocks finished lower.
Forward returns - 04
Enriched De-SPAC Events
Completed de-SPAC disclosures: average 1-month return of -13.3% (t = -2.7). 74% of stocks finished lower.
Forward returns - 05
Quant Galore Momentum Index
$1 grew to $40.9, versus $3.9 for SPY. Average monthly excess return: +2.9% (t = 2.2).
Forward returns - 06
Earnings Implied vs Realized
The implied move exceeded the realized move by 1.17% of spot on average (t = 6.8); it was larger 64% of the time.
Options pricing - 07
IV/HV Rank (52-Week)
High-rank IV changed by -28.0 volatility points over the next month, versus +7.7 at low ranks (difference t = -9.2).
Volatility - 08
IV/HV Premium
The implied-minus-forward-realized gap averaged +5.7 volatility points in the highest fifth versus -8.7 in the lowest (difference t = 14.3).
Volatility - 09
S&P 500 Risk Regime
Over the next 10 sessions, risk-off days led to 18.9% annualized volatility versus 12.2% after risk-on days (difference t = 2.3).
Volatility - 10
Vol-of-Vol Index
Top-decile volatility instability was followed by 59.5% annualized volatility, versus 52.2% in the comparison group (difference t = 3.2).
Volatility - 11
Wikipedia Views
Unusual Wikipedia attention was followed by 49.9% annualized volatility, versus 48.4% in the comparison group (difference t = 3.0).
Volatility
Simple questions. Measured outcomes.
- 01
Tested against real prices
Alphanume observations are joined to historical prices from Massive (formerly Polygon). Each study shows its sample dates and measures what happened after its stated entry point.
- 02
A clear comparison
SPY provides a market comparison where relevant. Volatility and movement studies compare clearly defined groups. The t-stat measures the reported average or difference.
- 03
Information before outcomes
Event studies start after disclosure. Scheduled events and daily signals use the entry rules listed with each study. Later outcomes are kept out of the selection rules.
- 04
Results across the sample
We check both halves of the study period and whether a single company drives the result. Statistical tests account for repeated companies and observations close together in time.
Returns are gross, before transaction costs, slippage, and borrow fees.
Pre-Market Drop Risk
700 observations · 2024-05-15–2026-09-18The premarket model ranks names by their estimated chance of falling at least 5% from open to close. This study uses scores of 70% or higher.
Names scoring at least 70% risk averaged -8.3% from open to close (t = -4.3); 76% closed lower.
Use the risk score to narrow a premarket screen to names with a pronounced historical downside tendency.
01.1Higher-risk selections had larger declines 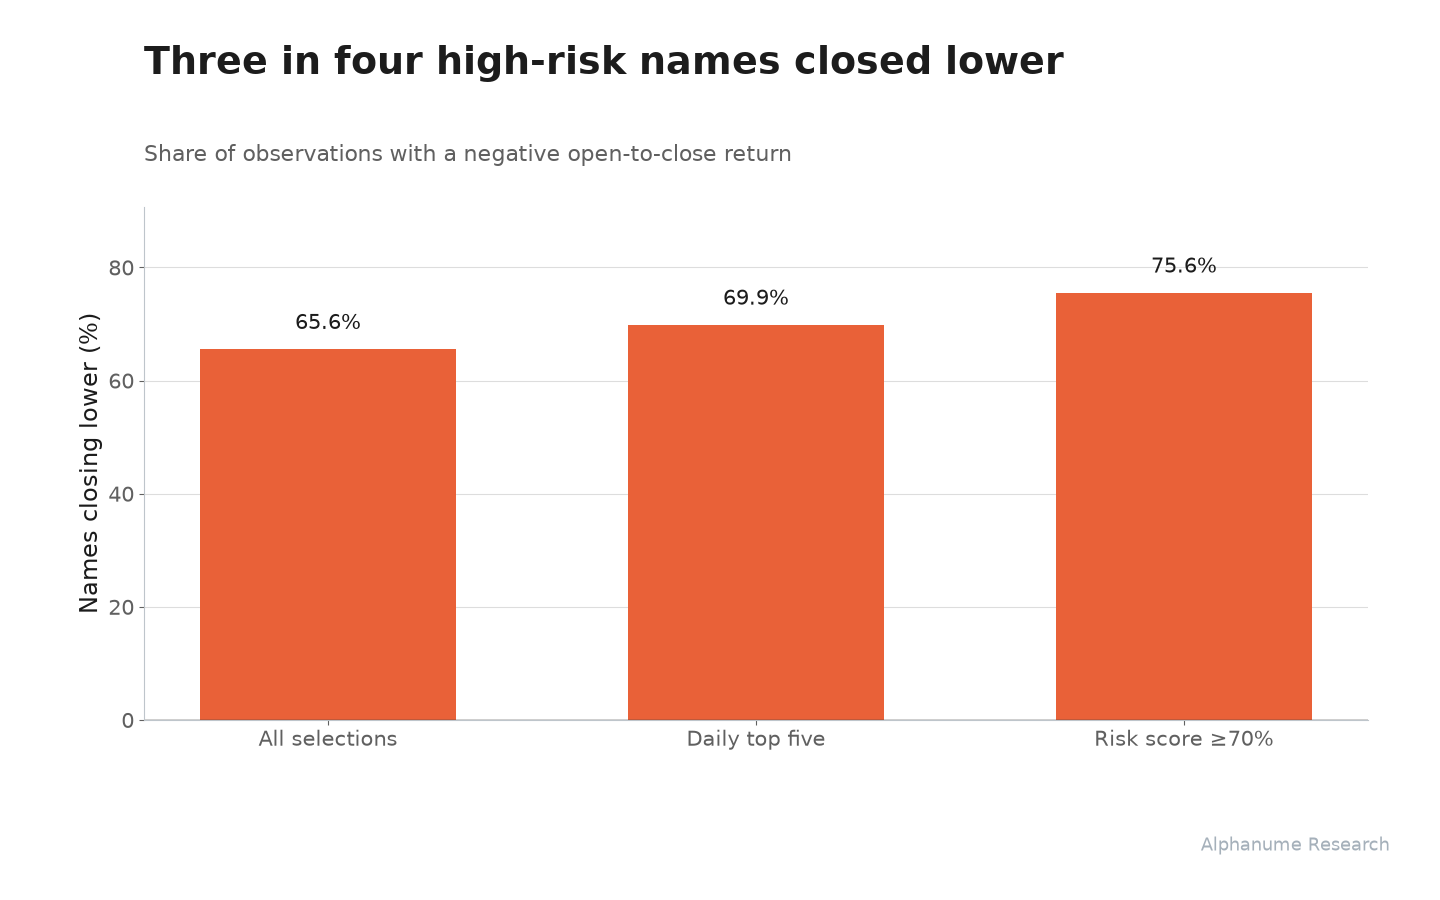
01.2Three in four high-risk names closed lower
Study details
Selection: model-estimated drop probability of at least 0.70, available before the regular-session open. Entry at the open and exit at the same-day close. Returns are independently calculated from Massive bars; each name-day has equal weight.
The reported t-stat tests the displayed mean against zero. Its 95% confidence interval is -12.21 to -4.36. Uncertainty uses 21-session calendar blocks; event samples also include an issuer-cluster variance allowance. The two calendar halves average -7.24 and -9.46 in the same units.
Toxic Financing
576 observations · 2024-01-03–2026-08-20Some financing deals price new shares at a discount to future market prices. This study isolates those variable-price announcements.
Variable-price financing announcements: average 1-month return of -8.4% (t = -2.4). 70% of stocks finished lower.
The deal terms help distinguish financing with persistent downside from the broader placement feed.
02.1Average forward returns, absolute and relative to SPY 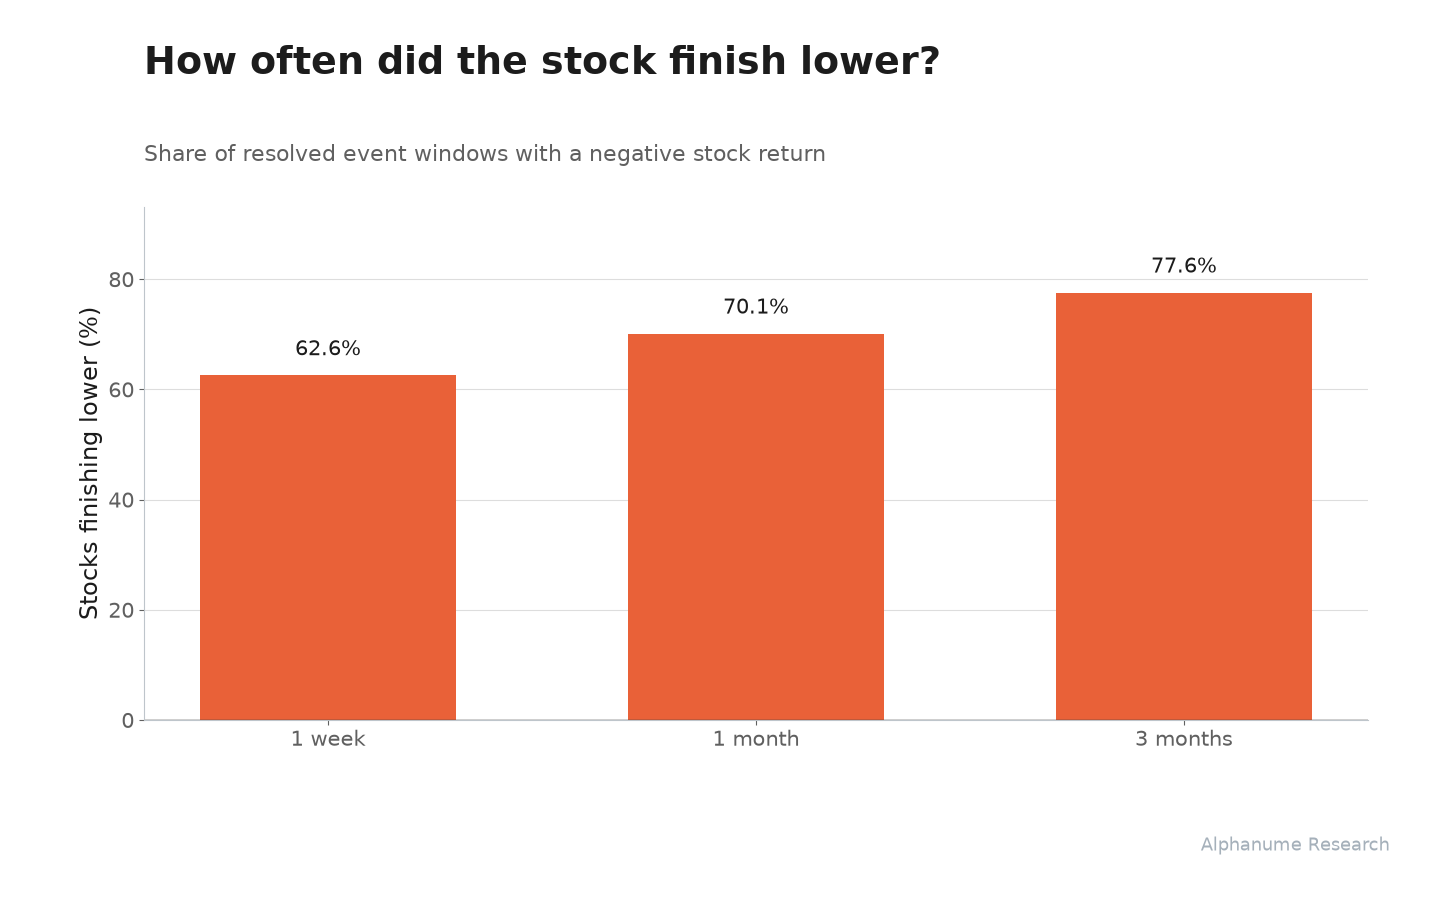
02.2Share of stocks lower at each holding period 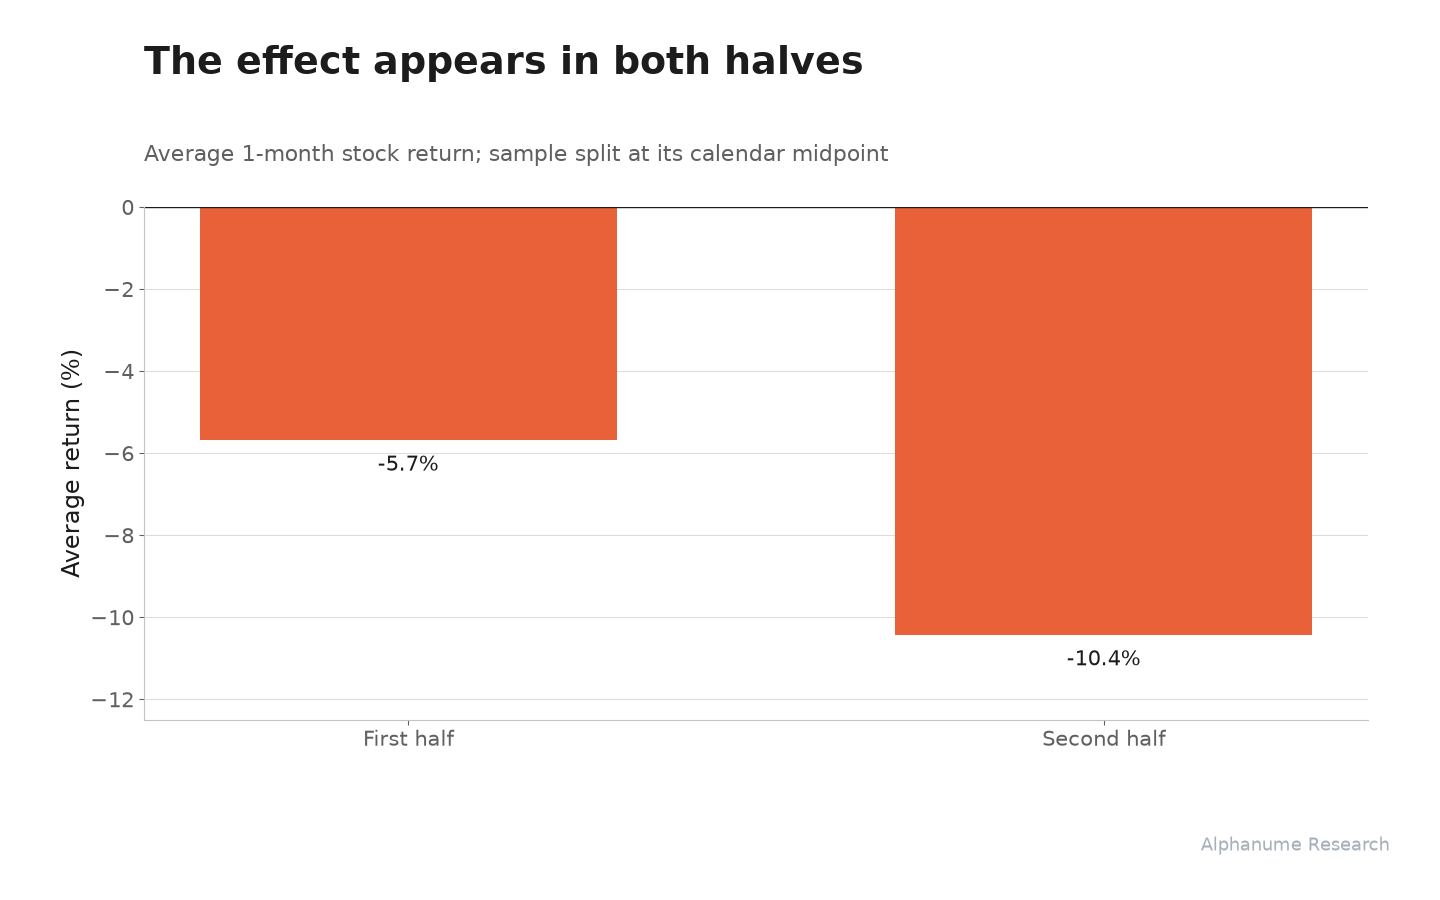
02.3Average 1-month return in each half of the sample
Study details
Cohort: Variable-price financing announcements. Filter: variable price. Entry is the first regular-session open after disclosure; reverse-split entries use the next session after execution. One month means 21 trading sessions, with exit at the final close.
Returns use split-adjusted prices and cash dividends. Each event is equally weighted. The median 1-month return is -13.8%; the average return relative to SPY is -9.9% over the same windows.
The reported t-stat tests the displayed mean against zero. Its 95% confidence interval is -16.37 to -0.50. Uncertainty uses 63-session calendar blocks; event samples also include an issuer-cluster variance allowance. The two calendar halves average -5.68 and -10.42 in the same units.
The 1-month sample contains 576 observations across 326 issuers. 27 events have not completed the holding period; 124 could not be resolved to valid entry and exit prices or a matching issuer. Those outcomes are excluded, not filled with zero.
Enriched Reverse Splits
1,570 observations · 2022-10-04–2026-08-20This study follows reverse splits of at least 1-for-10, which turn ten or more old shares into one new share. We measure returns after the split takes effect.
Reverse splits of 1-for-10 or larger: average 1-month return of -9.4% (t = -4.0). 69% of stocks finished lower.
The split ratio provides a simple way to screen a calendar for subsequent downside.
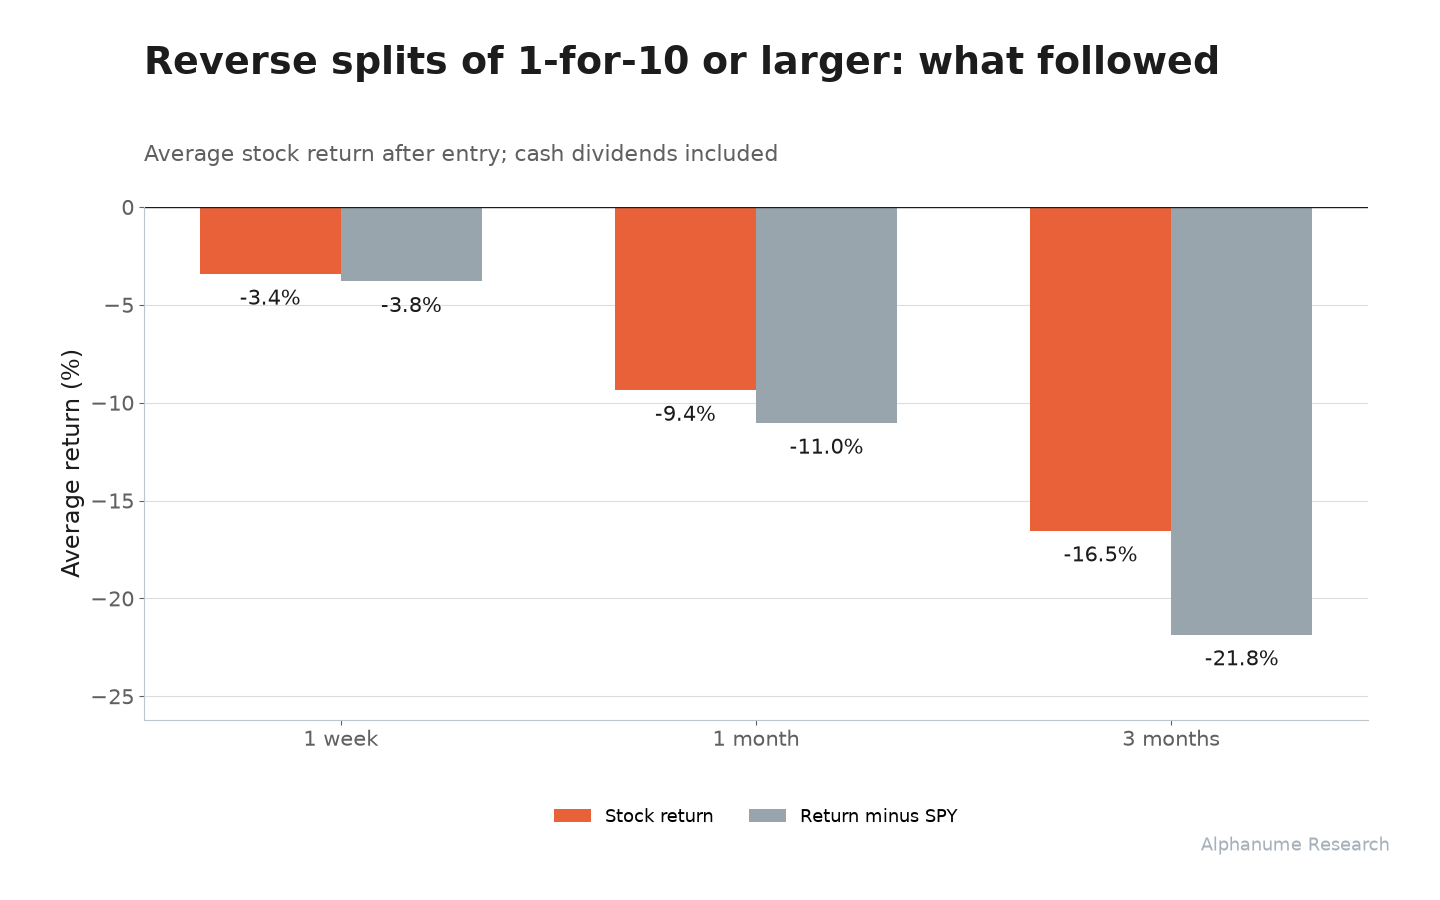
03.1Average forward returns, absolute and relative to SPY 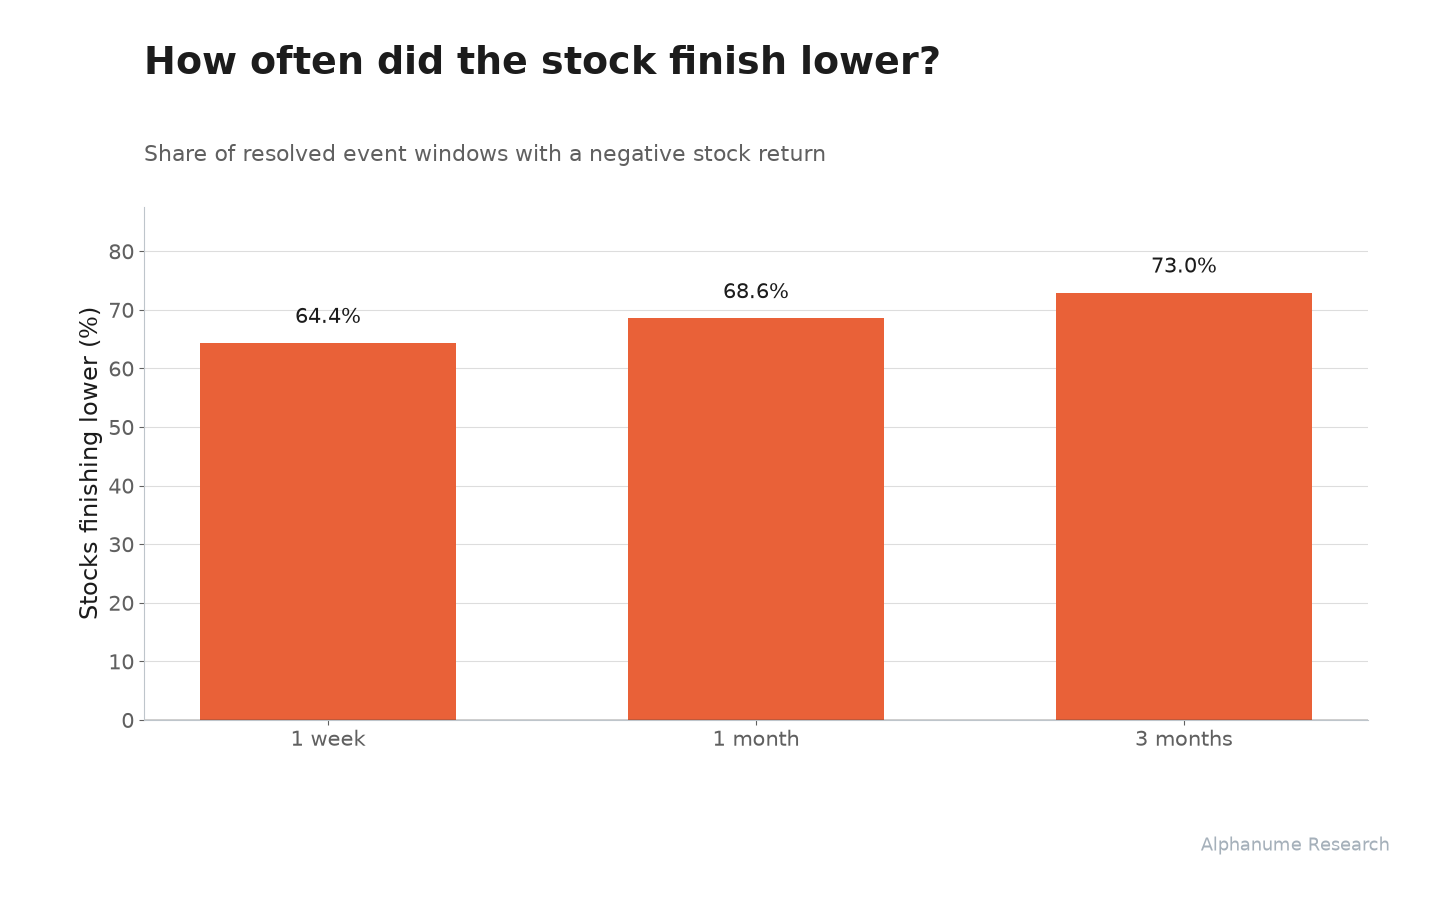
03.2Share of stocks lower at each holding period 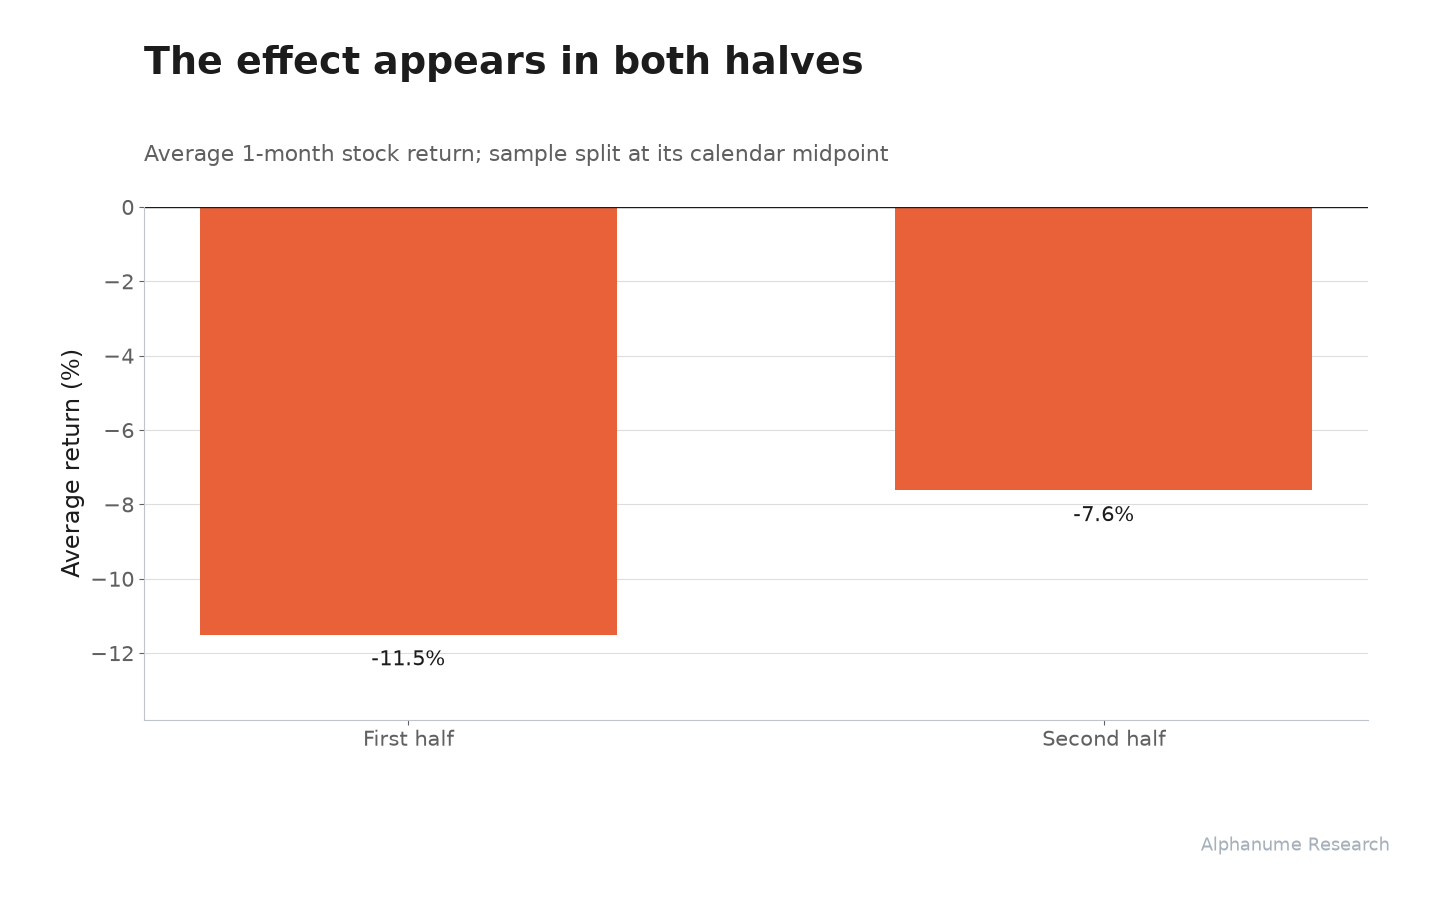
03.3Average 1-month return in each half of the sample
Study details
Cohort: Reverse splits of 1-for-10 or larger. Filter: ratio at most 0.1. Entry is the first regular-session open after disclosure; reverse-split entries use the next session after execution. One month means 21 trading sessions, with exit at the final close.
Returns use split-adjusted prices and cash dividends. Each event is equally weighted. The median 1-month return is -16.0%; the average return relative to SPY is -11.0% over the same windows.
The reported t-stat tests the displayed mean against zero. Its 95% confidence interval is -14.33 to -4.37. Uncertainty uses 63-session calendar blocks; event samples also include an issuer-cluster variance allowance. The two calendar halves average -11.50 and -7.62 in the same units.
The 1-month sample contains 1,570 observations across 1,180 issuers. 90 events have not completed the holding period; 1,101 could not be resolved to valid entry and exit prices or a matching issuer. Those outcomes are excluded, not filled with zero.
Enriched De-SPAC Events
271 observations · 2021-01-06–2026-08-10This study follows completed mergers after the first timely completion filing.
Completed de-SPAC disclosures: average 1-month return of -13.3% (t = -2.7). 74% of stocks finished lower.
The completion date turns a broad SPAC universe into a specific post-merger trading cohort.
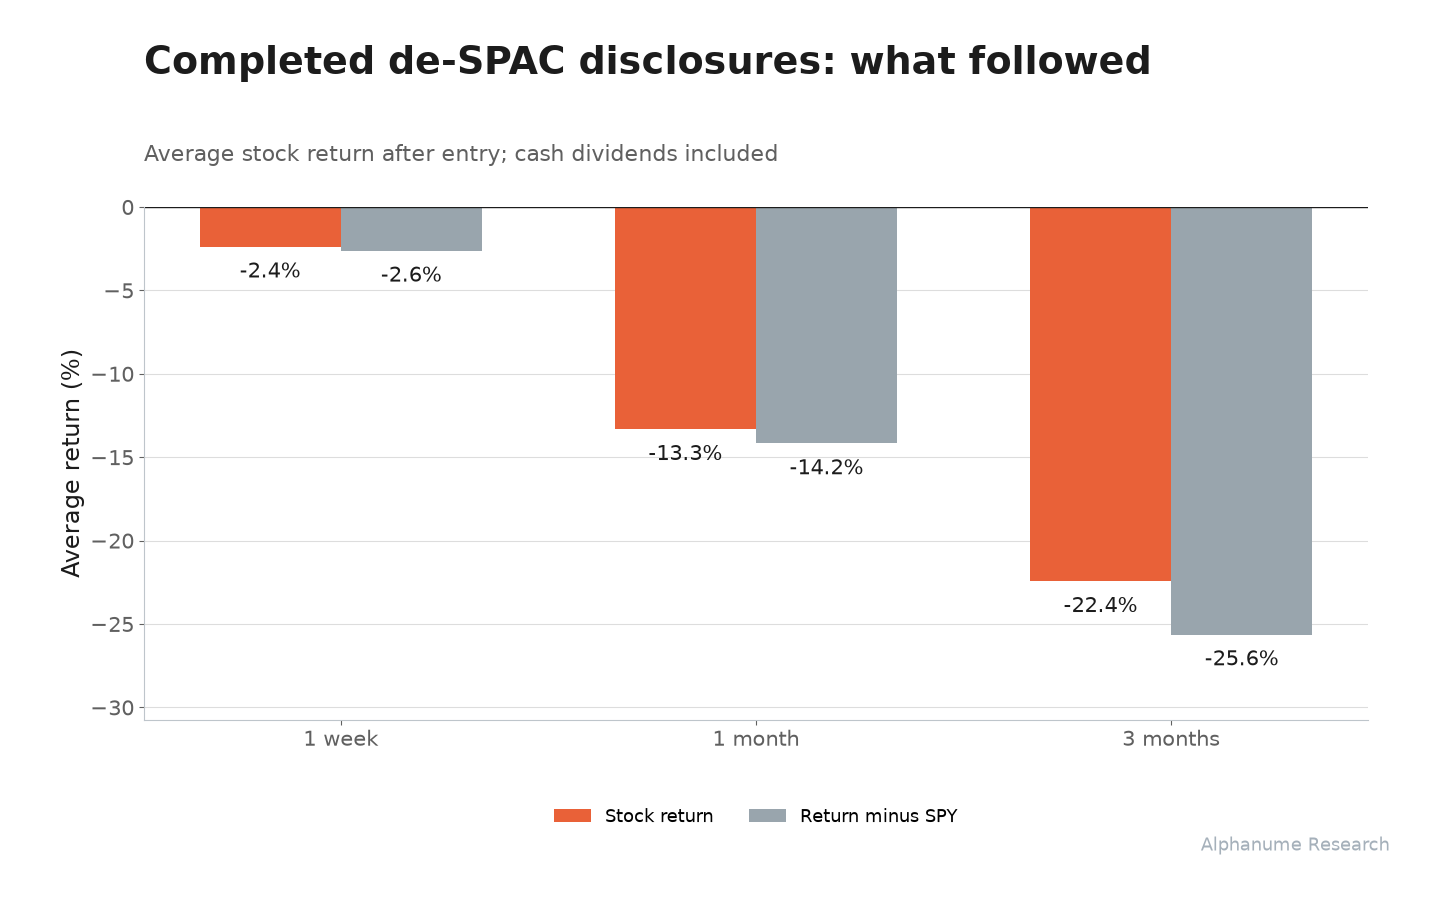
04.1Average forward returns, absolute and relative to SPY 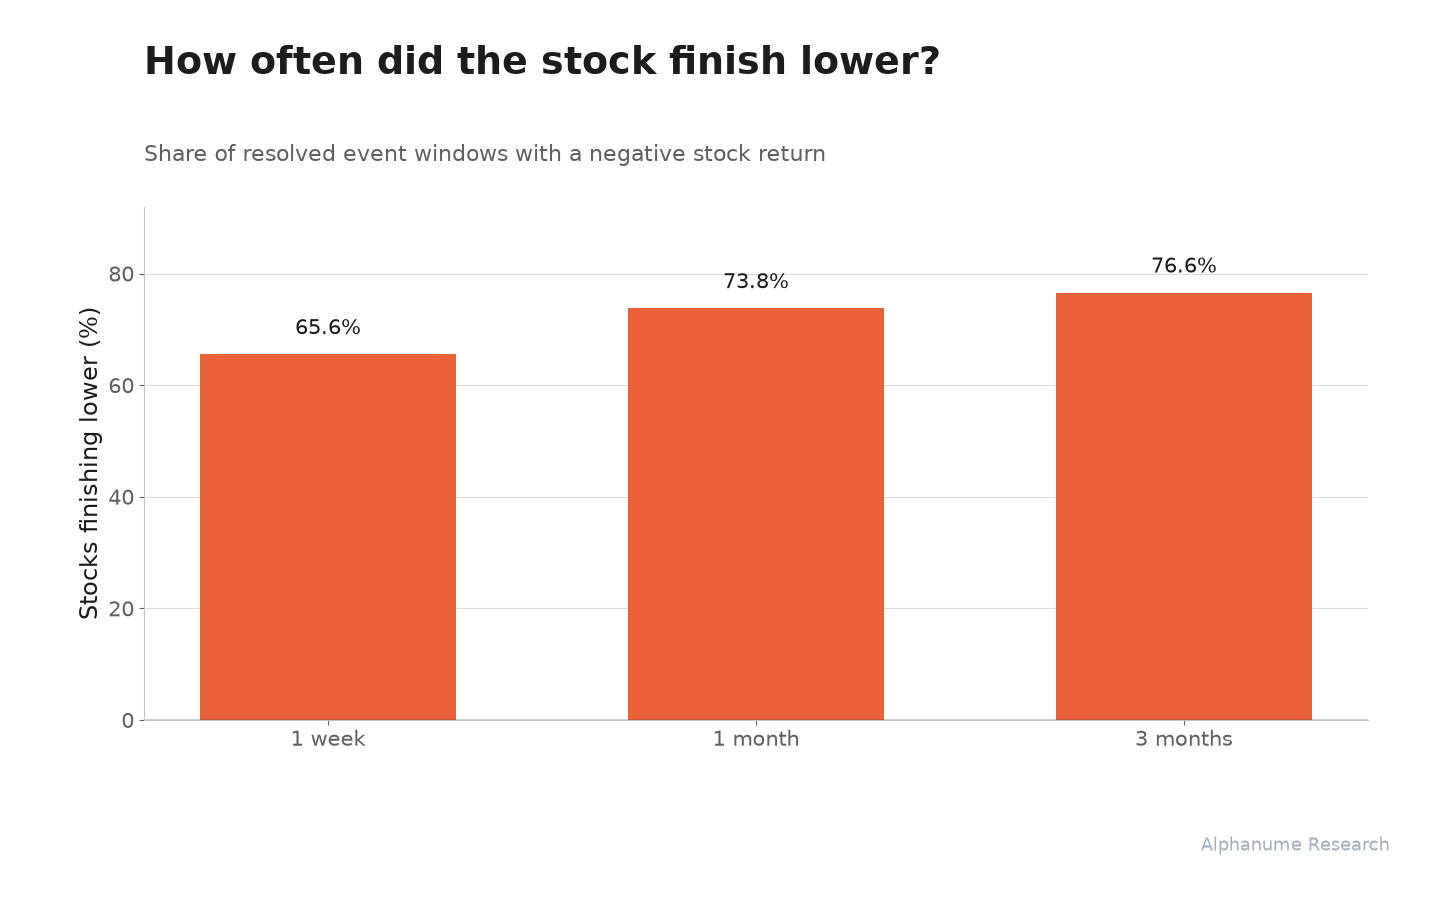
04.2Share of stocks lower at each holding period 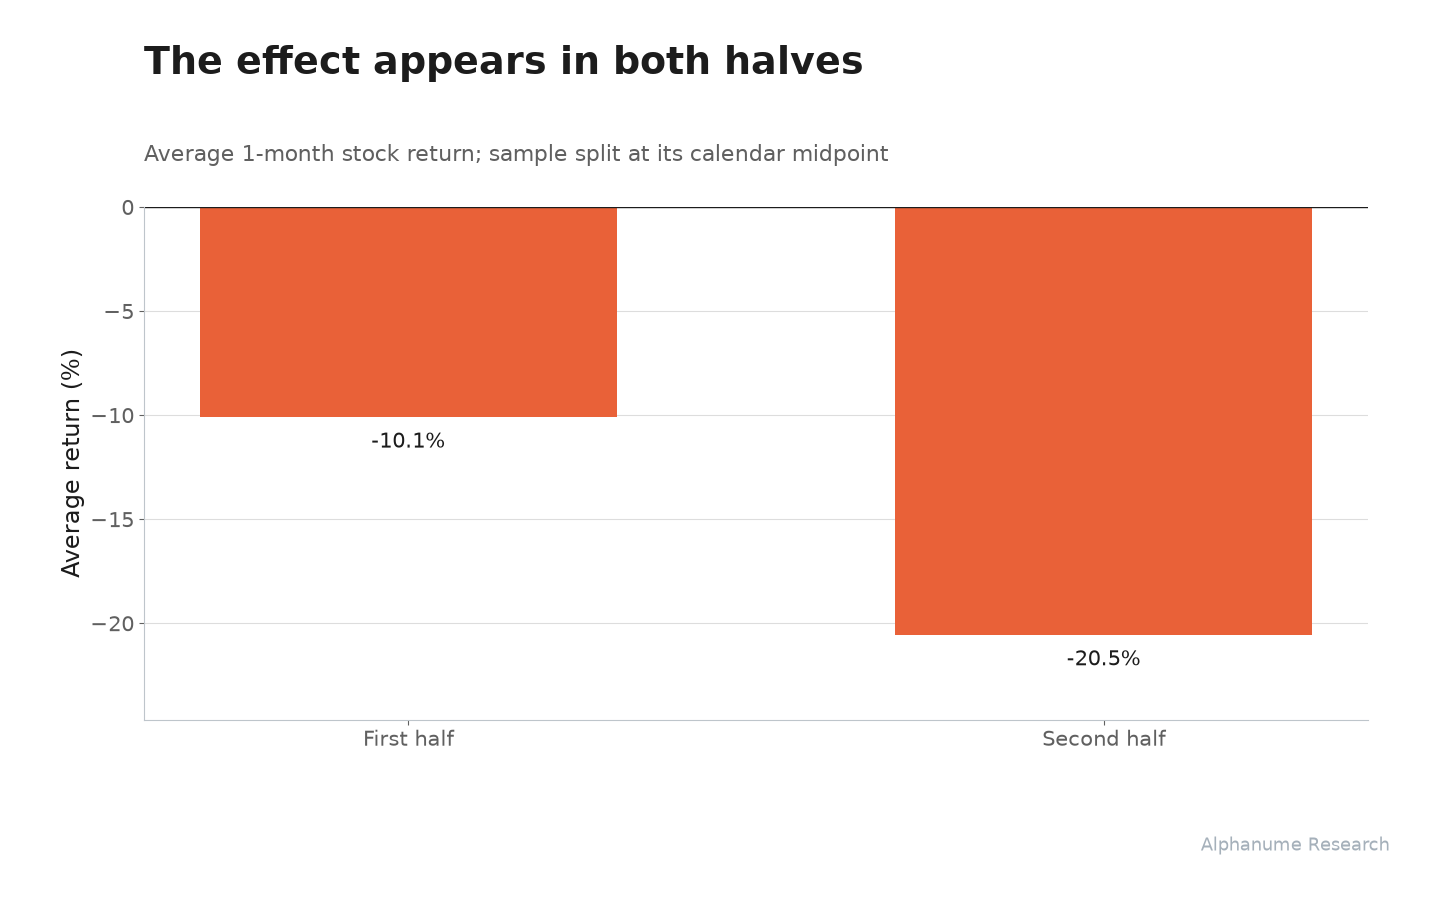
04.3Average 1-month return in each half of the sample
Study details
Completed deals with a verified post-merger ticker and a completion disclosure within 14 calendar days of closing. Entry is the next regular-session open after that disclosure; one month means 21 trading sessions. Later restatements are not new events.
Returns use split-adjusted prices and cash dividends. Each event is equally weighted. The median 1-month return is -19.6%; the average return relative to SPY is -14.2% over the same windows.
The reported t-stat tests the displayed mean against zero. Its 95% confidence interval is -23.44 to -3.20. Uncertainty uses 63-session calendar blocks; event samples also include an issuer-cluster variance allowance. The two calendar halves average -10.08 and -20.54 in the same units.
The 1-month sample contains 271 observations across 271 issuers. 2 events have not completed the holding period; 9 could not be resolved to valid entry and exit prices or a matching issuer. Those outcomes are excluded, not filled with zero.
Quant Galore Momentum Index
116 monthly holding periods · 2017-01-04–2026-08-04A ten-stock momentum basket, equally weighted at each monthly rebalance.
$1 grew to $40.9, versus $3.9 for SPY. Average monthly excess return: +2.9% (t = 2.2).
The constituent history provides a direct starting point for a rules-based momentum allocation.
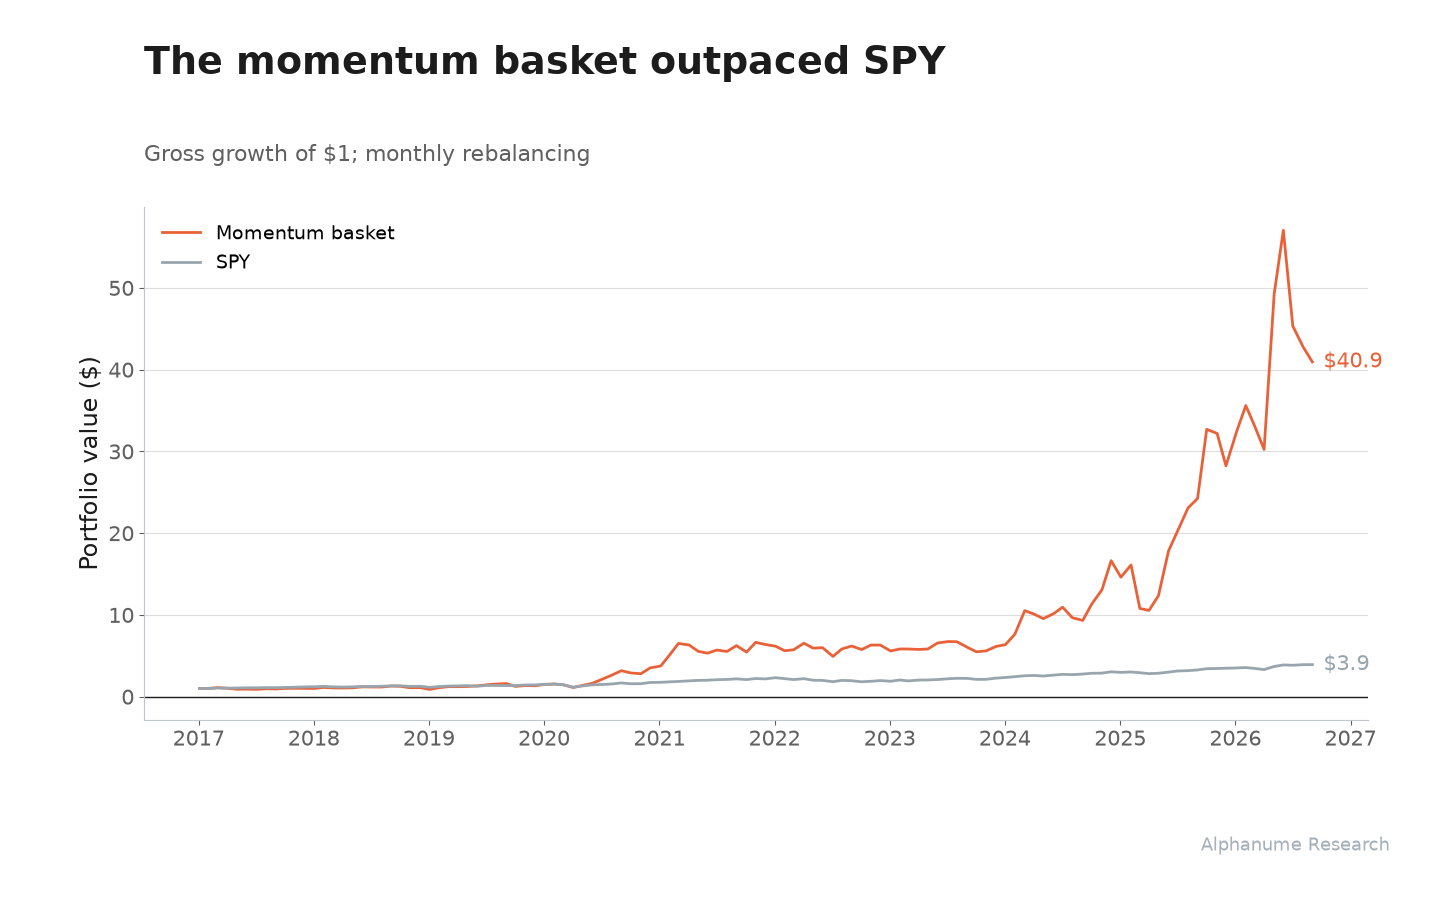
05.1Growth of $1 in the momentum basket and SPY 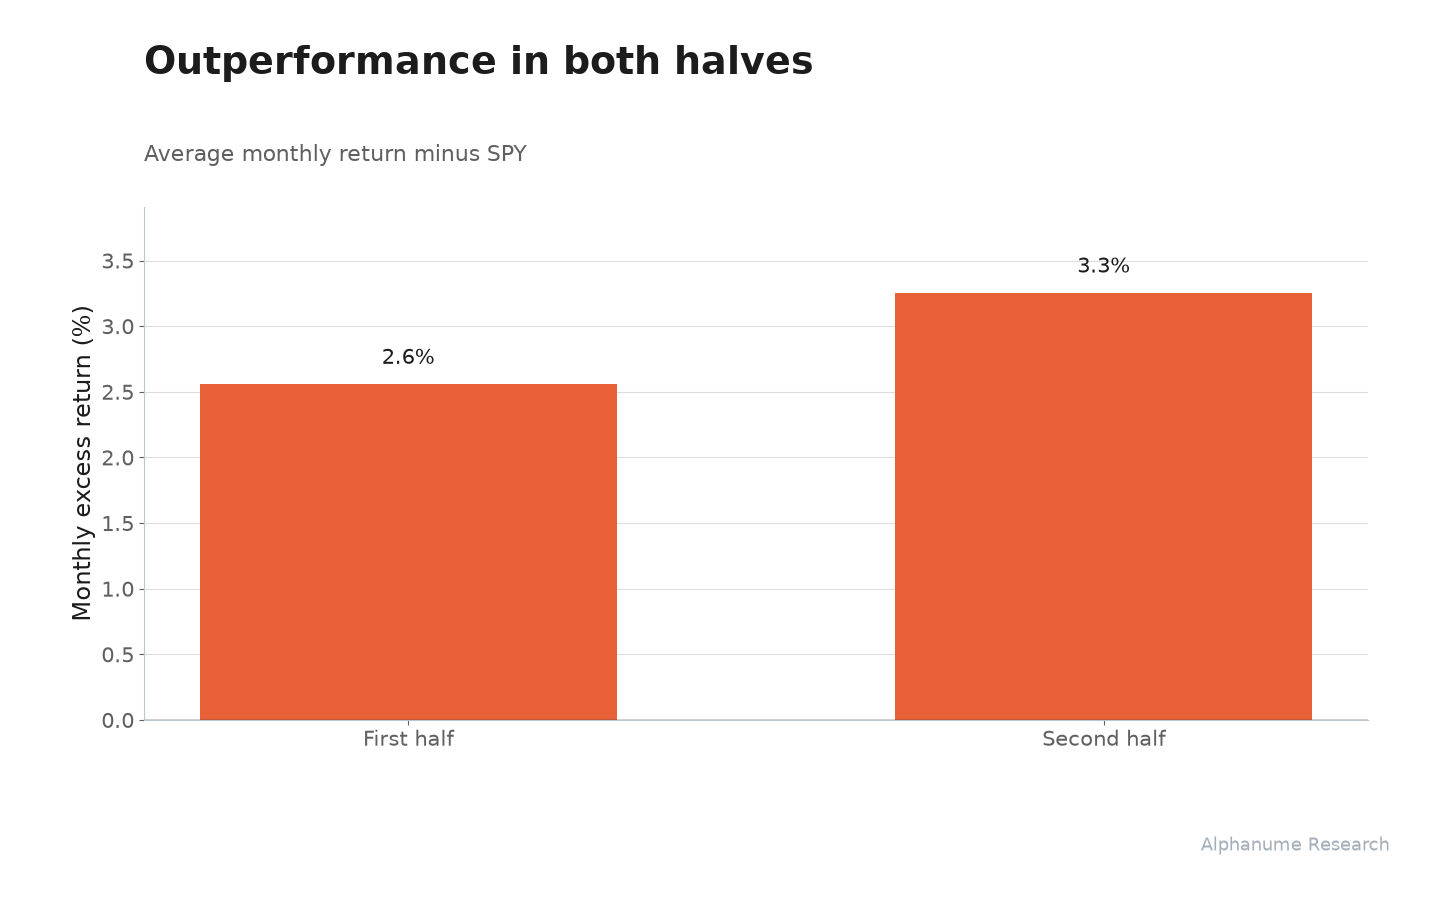
05.2Outperformance in both halves
Study details
Buy the published constituents in equal weights at the next regular-session open after the rebalance date. Hold until the next rebalance open, include cash dividends, then rebalance. Only complete ten-stock periods are included. The displayed t-stat tests average monthly basket return minus SPY; growth curves compound the respective portfolio returns.
The reported t-stat tests the displayed mean against zero. Its 95% confidence interval is +0.23 to +5.59. Uncertainty uses 63-session calendar blocks; event samples also include an issuer-cluster variance allowance. The two calendar halves average +2.56 and +3.26 in the same units.
Earnings Implied vs Realized
3,868 observations · 2024-01-04–2026-09-17Before earnings, the at-the-money straddle prices an expected move. We compare that price with the stock’s actual earnings reaction.
The implied move exceeded the realized move by 1.17% of spot on average (t = 6.8); it was larger 64% of the time.
Use the event history to compare how much movement options priced with how much the stock delivered.
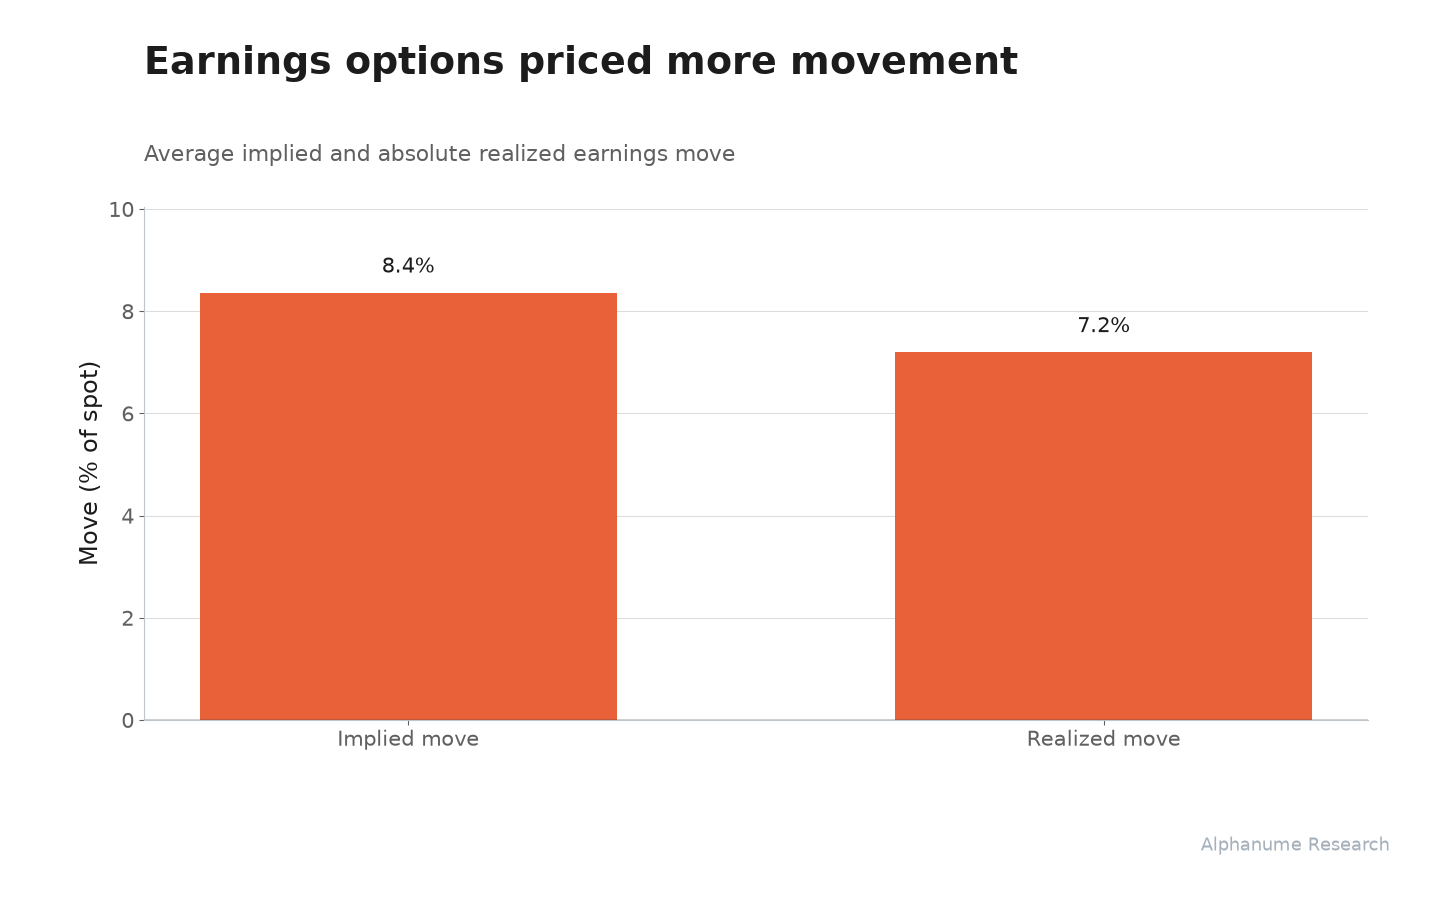
06.1Earnings options priced more movement 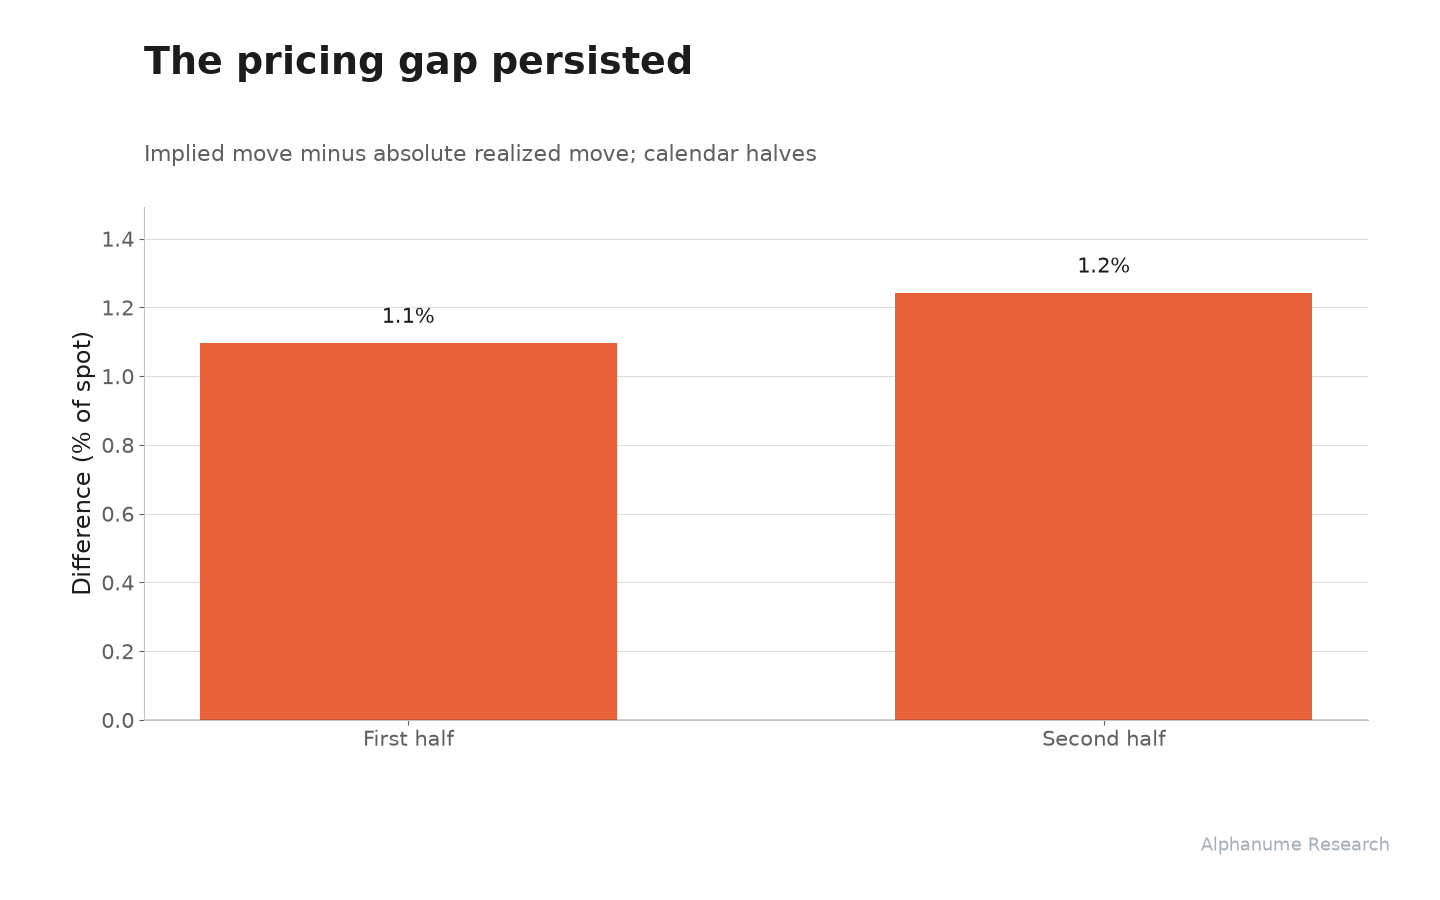
06.2The pricing gap persisted
Study details
The pre-earnings straddle-implied percentage is compared with the absolute stock return between the documented capture close and reaction close, independently checked against Massive prices. The difference is measured as a percentage of spot; it is a pricing comparison, not a realized option-trade return.
The reported t-stat tests the displayed mean against zero. Its 95% confidence interval is +0.82 to +1.52. Uncertainty uses 21-session calendar blocks; event samples also include an issuer-cluster variance allowance. The two calendar halves average +1.10 and +1.24 in the same units.
IV/HV Rank (52-Week)
406 daily comparisons · 2024-12-31–2026-08-19IV rank places implied volatility within its own trailing one-year range. We compare ranks of at least 80 with ranks of 20 or less.
High-rank IV changed by -28.0 volatility points over the next month, versus +7.7 at low ranks (difference t = -9.2).
The rank helps identify where implied volatility has historically had room to fall or rise.
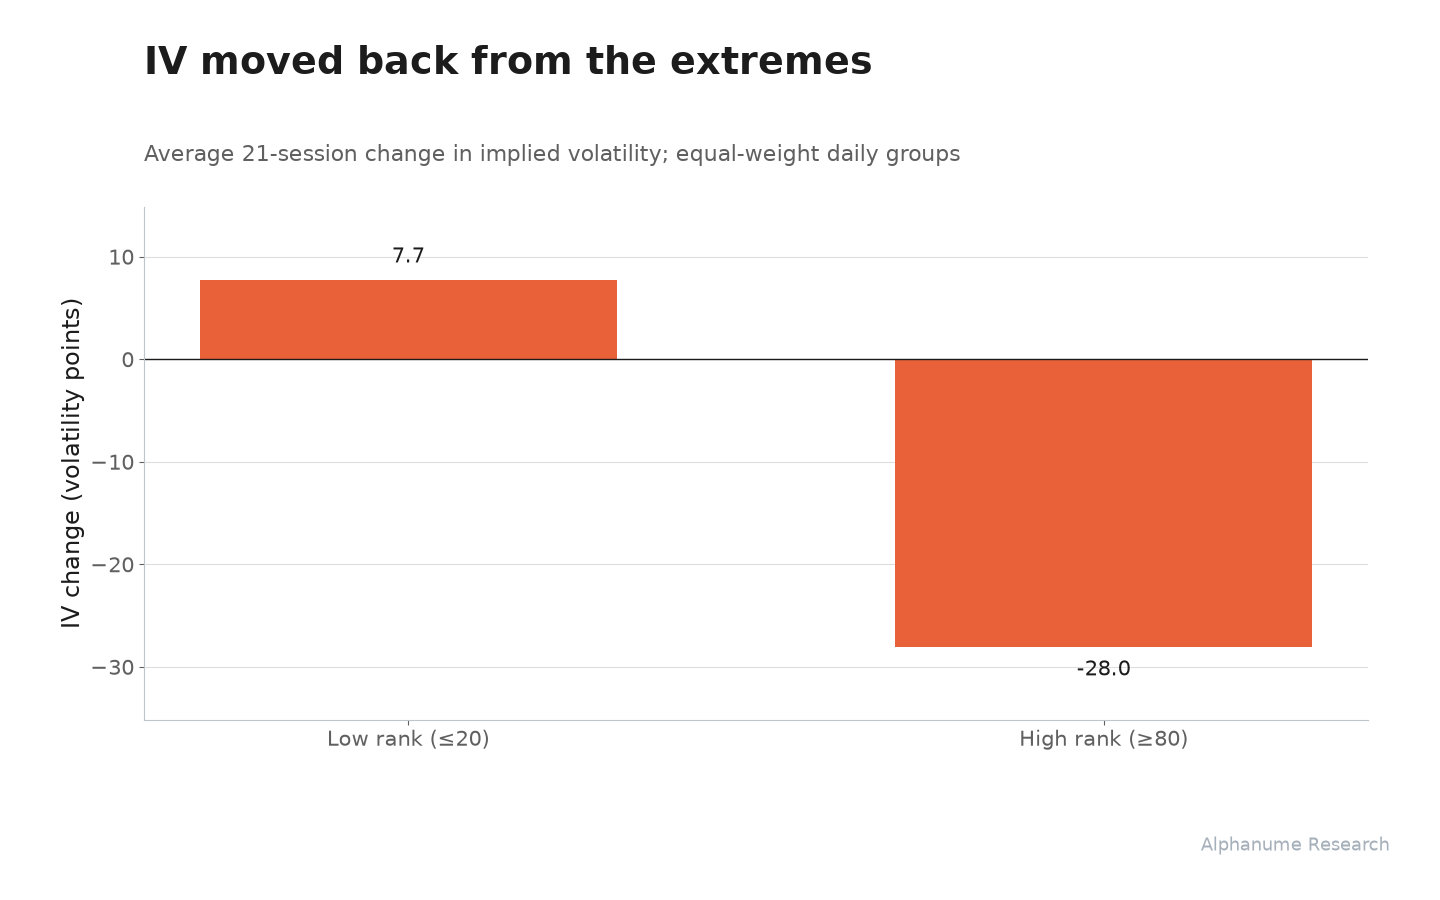
07.1IV moved back from the extremes 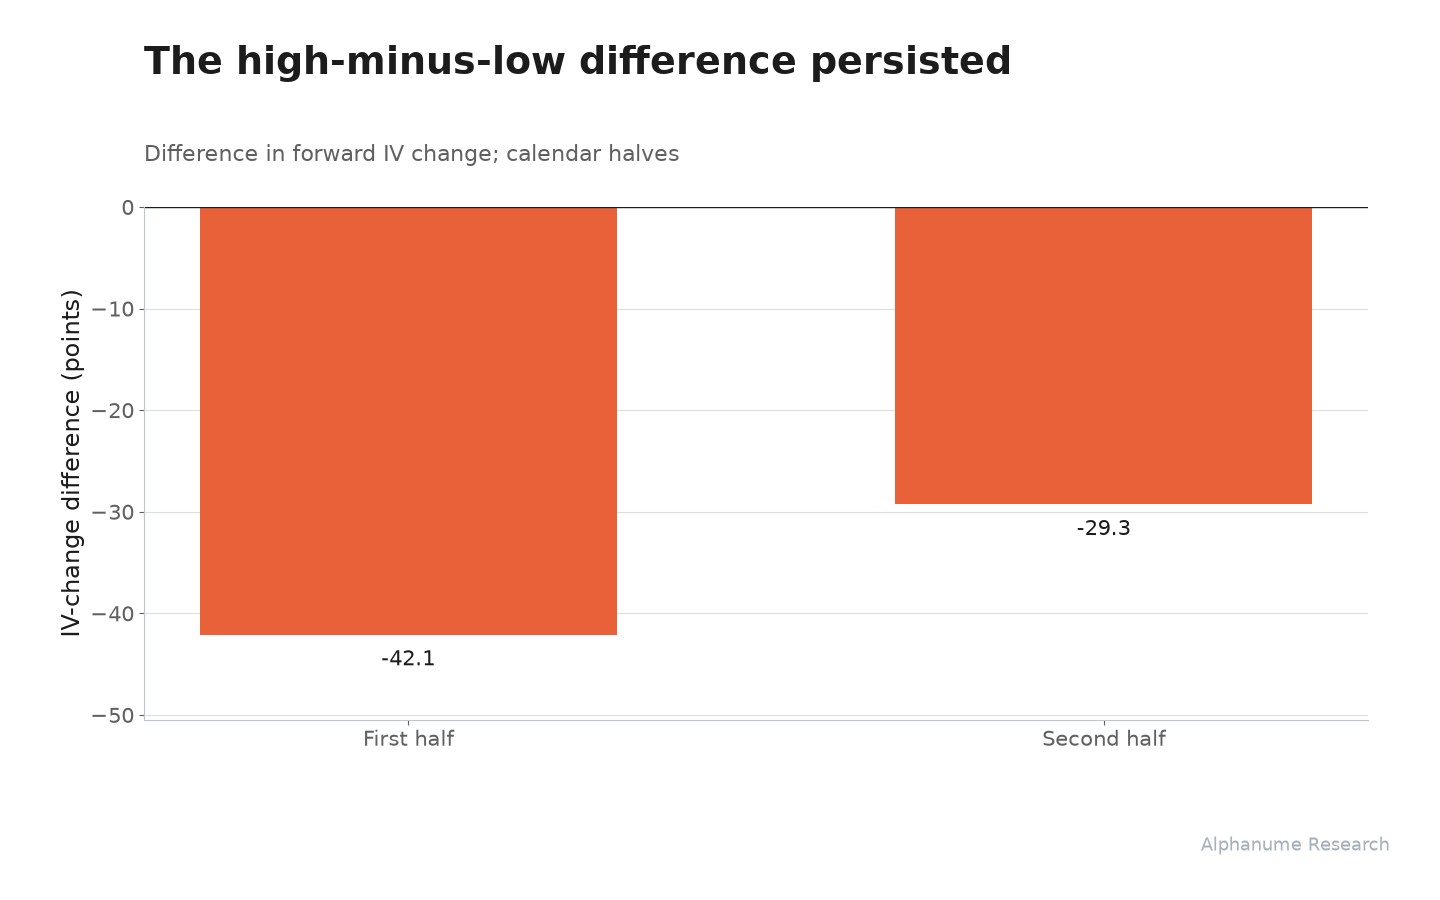
07.2The high-minus-low difference persisted
Study details
Use final daily observations only. Compare IV with its final reading exactly 21 trading sessions later, requiring both observations. Group averages are calculated each day, then averaged across common dates. The t-stat tests high-rank minus low-rank IV change, in volatility points.
The reported t-stat tests the displayed mean against zero. Its 95% confidence interval is -43.90 to -27.57. Uncertainty uses 21-session calendar blocks; event samples also include an issuer-cluster variance allowance. The two calendar halves average -42.08 and -29.26 in the same units.
IV/HV Premium
660 daily comparisons · 2024-01-02–2026-08-19The IV/HV ratio compares option-implied volatility with trailing realized volatility. Each day, we compare its highest and lowest fifths.
The implied-minus-forward-realized gap averaged +5.7 volatility points in the highest fifth versus -8.7 in the lowest (difference t = 14.3).
Use the ratio to screen where implied volatility has been rich or cheap relative to the movement that followed.
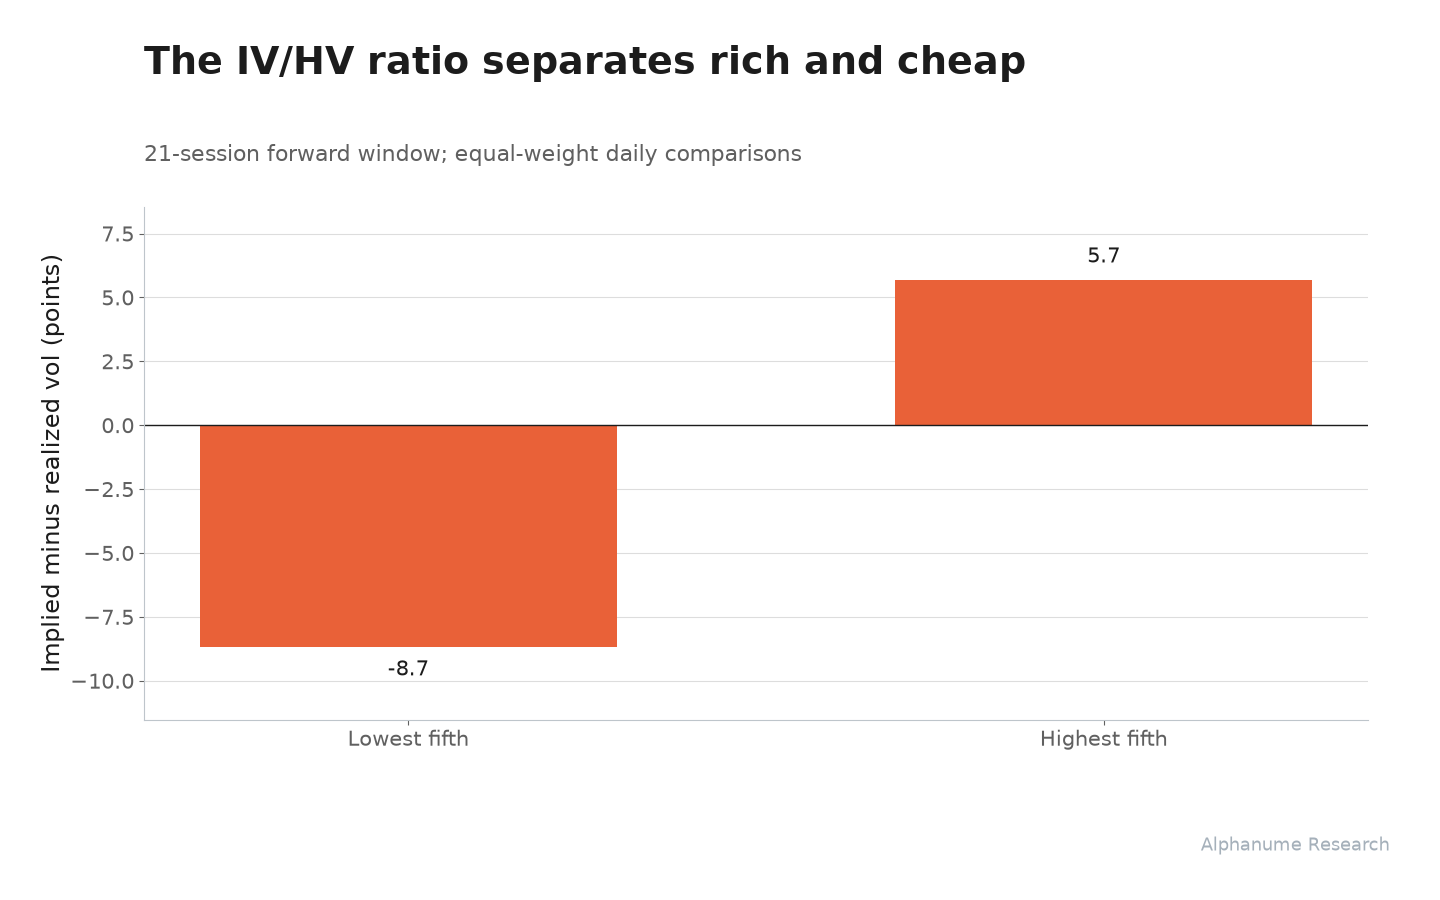
08.1The IV/HV ratio separates rich and cheap 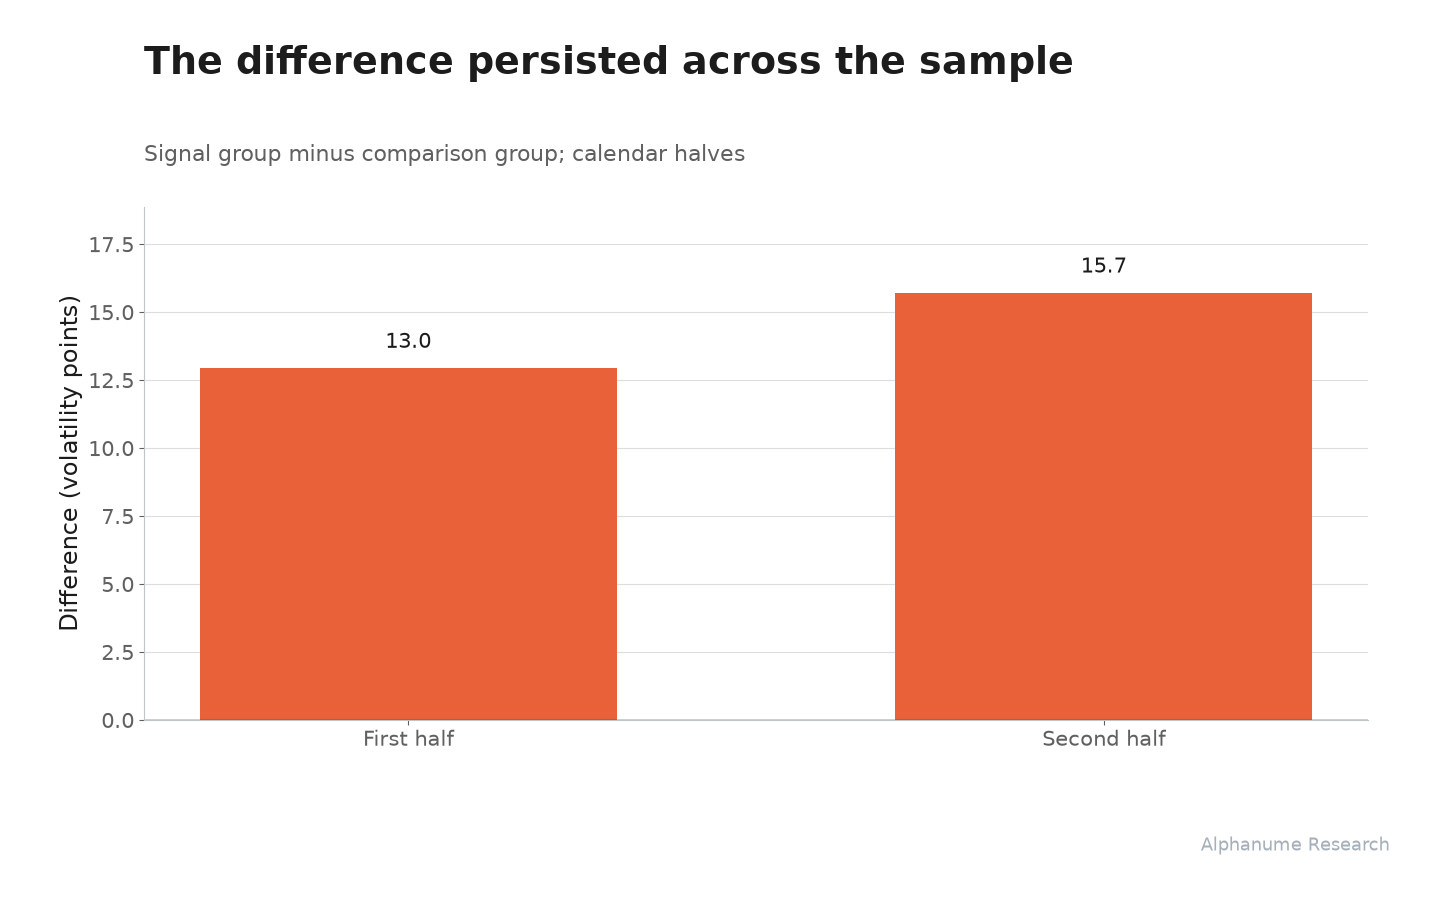
08.2The difference persisted across the sample
Study details
Forward realized volatility uses returns from the next regular-session open through the 21st close, including intervening overnight returns and cash dividends; annualization uses 252 sessions. Observations require a complete price window. The t-stat tests the average daily group difference.
The reported t-stat tests the displayed mean against zero. Its 95% confidence interval is +12.29 to +16.39. Uncertainty uses 21-session calendar blocks; event samples also include an issuer-cluster variance allowance. The two calendar halves average +12.95 and +15.72 in the same units.
S&P 500 Risk Regime
3,879 daily comparisons · 2011-03-30–2026-09-03The risk-regime flag separates quieter and more volatile market conditions.
Over the next 10 sessions, risk-off days led to 18.9% annualized volatility versus 12.2% after risk-on days (difference t = 2.3).
Use the regime flag to condition exposure size and volatility assumptions on the market environment.
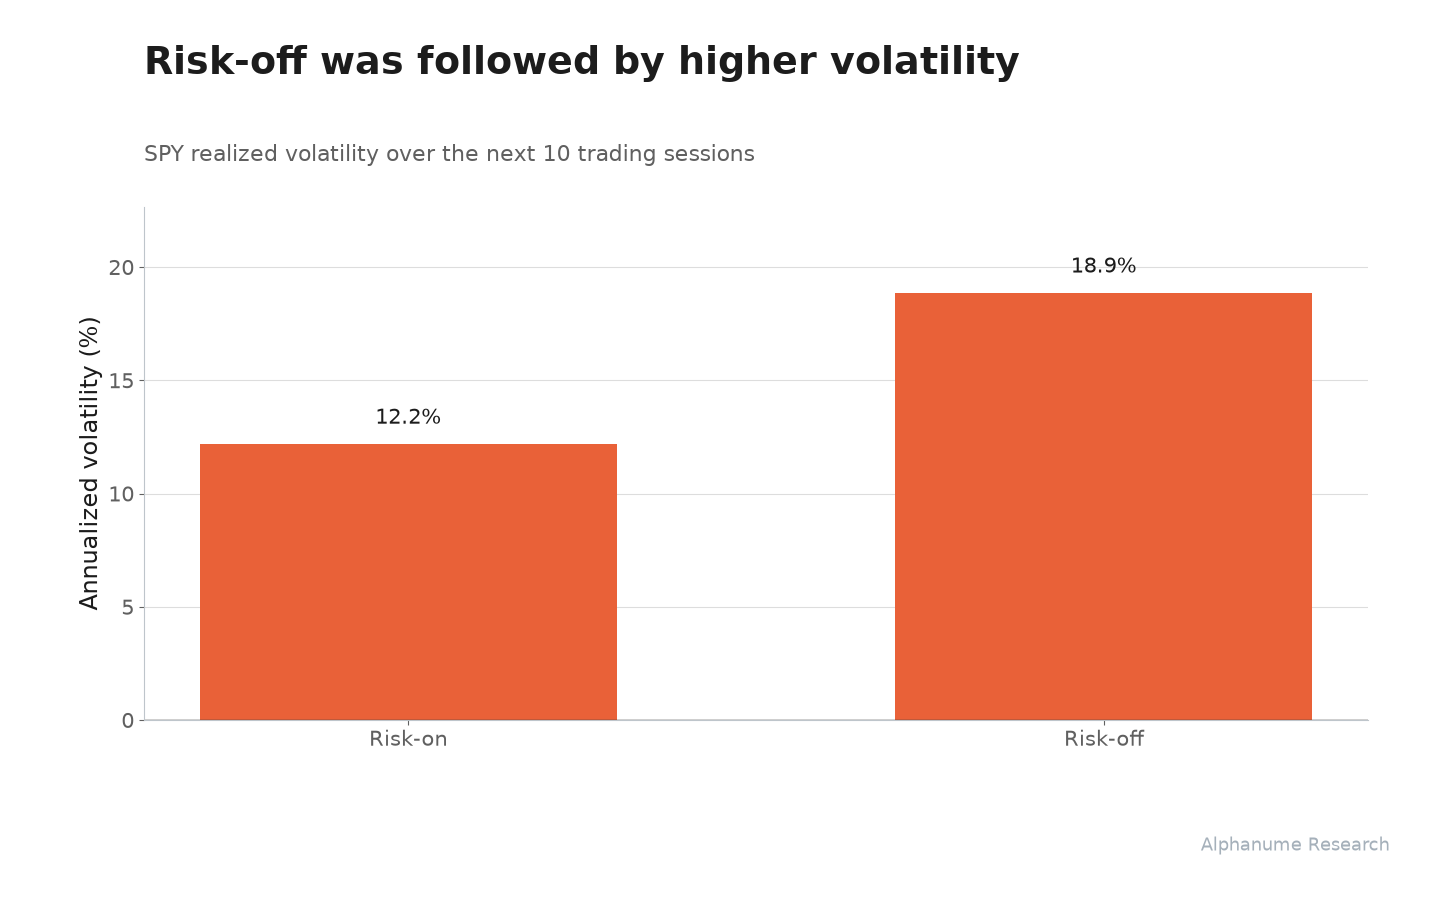
09.1Risk-off was followed by higher volatility 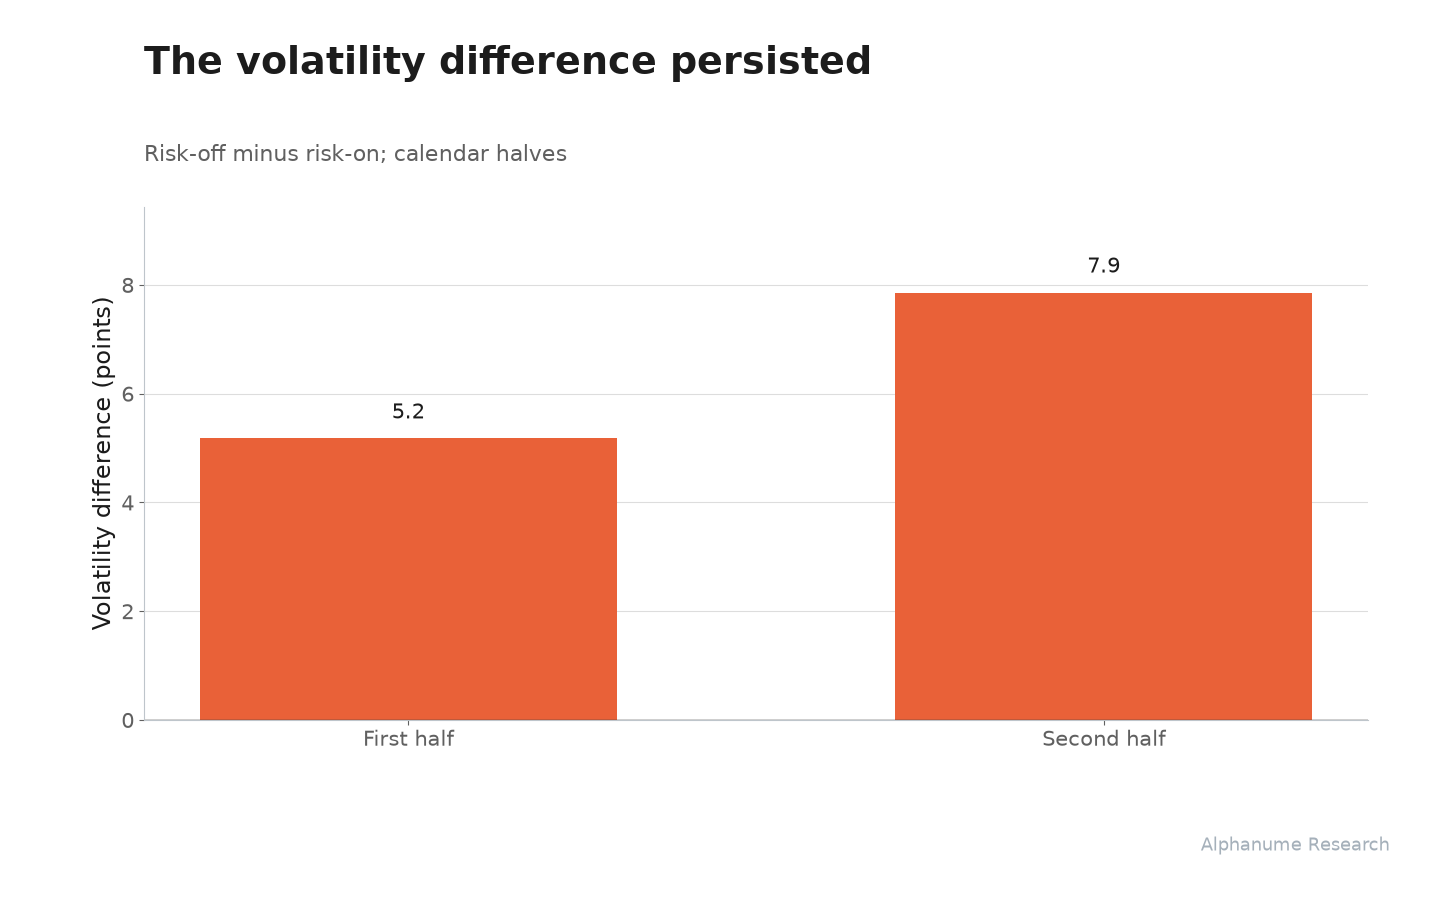
09.2The volatility difference persisted
Study details
The flag is available during the session. Forward volatility uses the next ten SPY close-to-close total returns, starting from that session’s close, annualized with 252 trading days. The test measures the difference between risk-off and risk-on averages.
The reported t-stat tests the displayed mean against zero. Its 95% confidence interval is +0.95 to +12.40. Uncertainty uses 21-session calendar blocks; event samples also include an issuer-cluster variance allowance. The two calendar halves average +5.18 and +7.86 in the same units.
Vol-of-Vol Index
640 daily comparisons · 2024-01-31–2026-08-19We compare the most and least unstable tenth of implied-volatility observations each day.
Top-decile volatility instability was followed by 59.5% annualized volatility, versus 52.2% in the comparison group (difference t = 3.2).
Use the extreme tail to identify names that tend to deliver larger subsequent fluctuations.
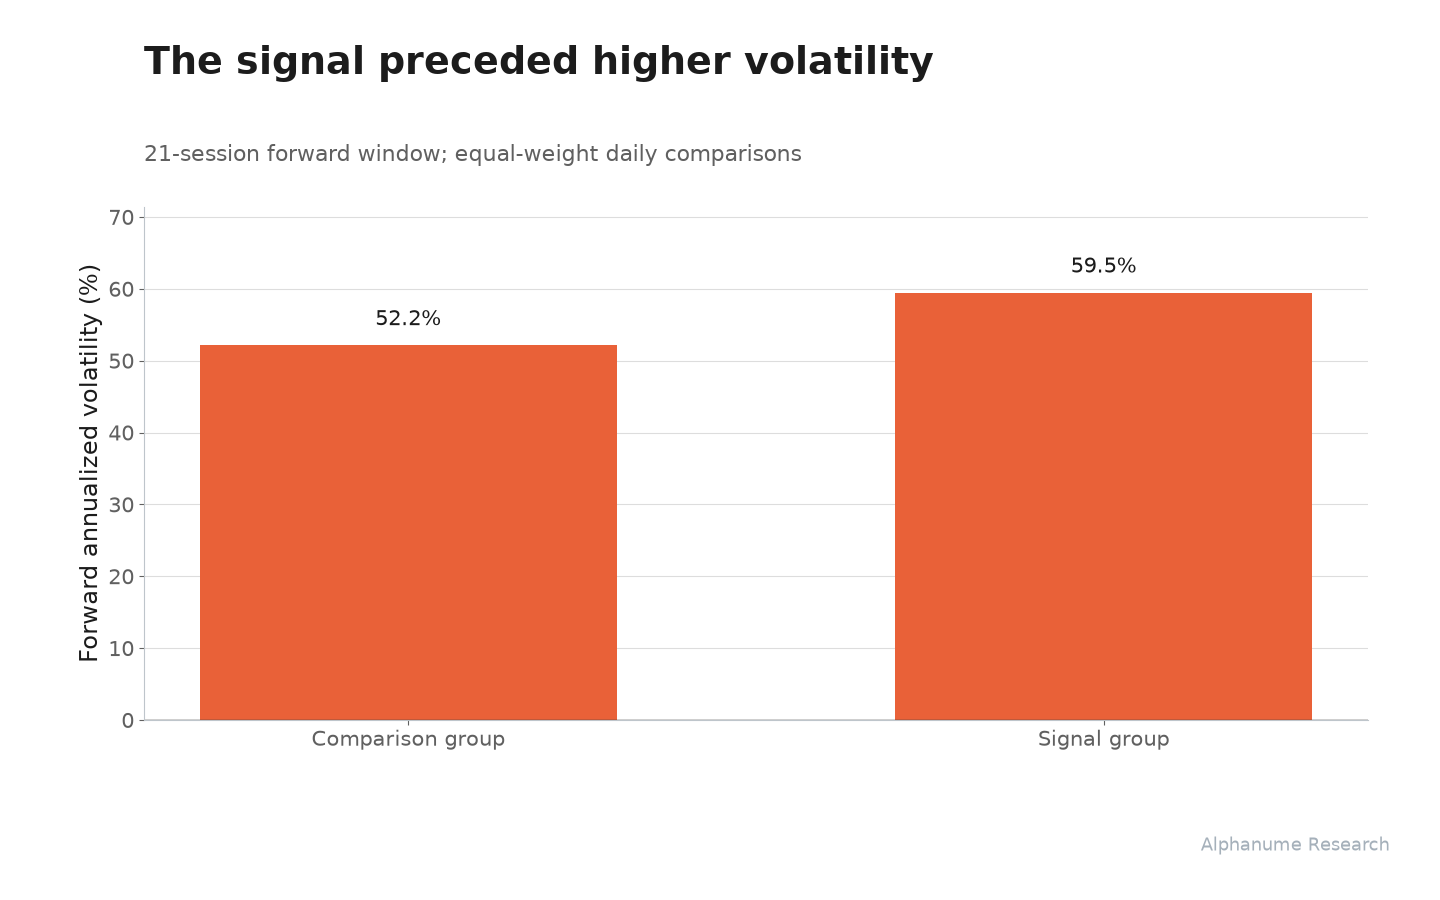
10.1The signal preceded higher volatility 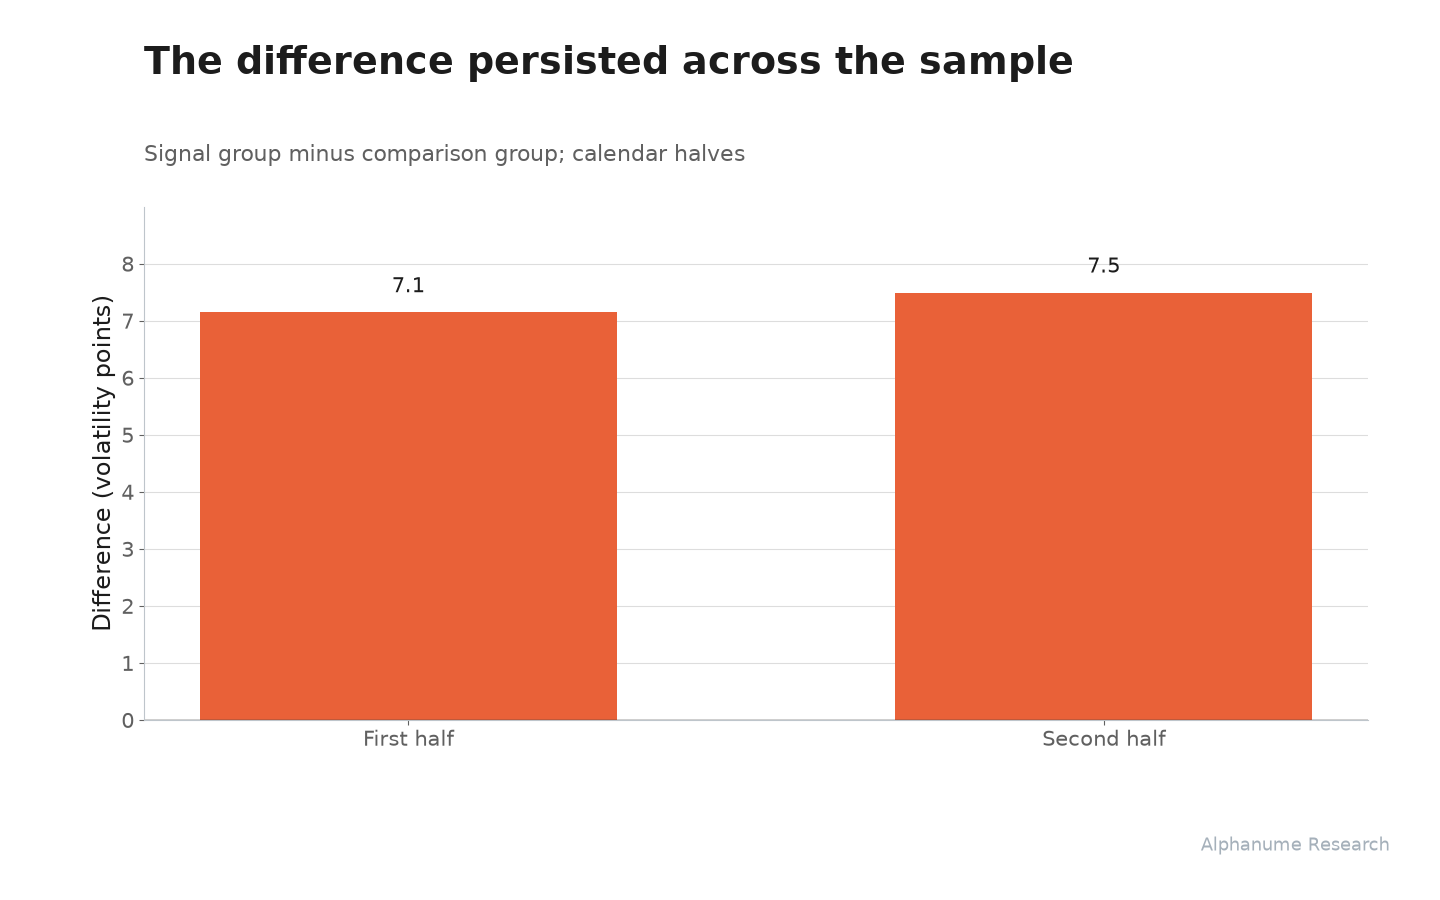
10.2The difference persisted across the sample
Study details
Forward realized volatility uses returns from the next regular-session open through the 21st close, including intervening overnight returns and cash dividends; annualization uses 252 sessions. Observations require a complete price window. The t-stat tests the average daily group difference.
The reported t-stat tests the displayed mean against zero. Its 95% confidence interval is +2.63 to +12.01. Uncertainty uses 21-session calendar blocks; event samples also include an issuer-cluster variance allowance. The two calendar halves average +7.15 and +7.49 in the same units.
Wikipedia Views
638 daily comparisons · 2024-02-05–2026-08-20We compare activity spikes with quieter observations at similar trailing stock volatility.
Unusual Wikipedia attention was followed by 49.9% annualized volatility, versus 48.4% in the comparison group (difference t = 3.0).
Use the activity feed to add context to a screen for future stock movement.
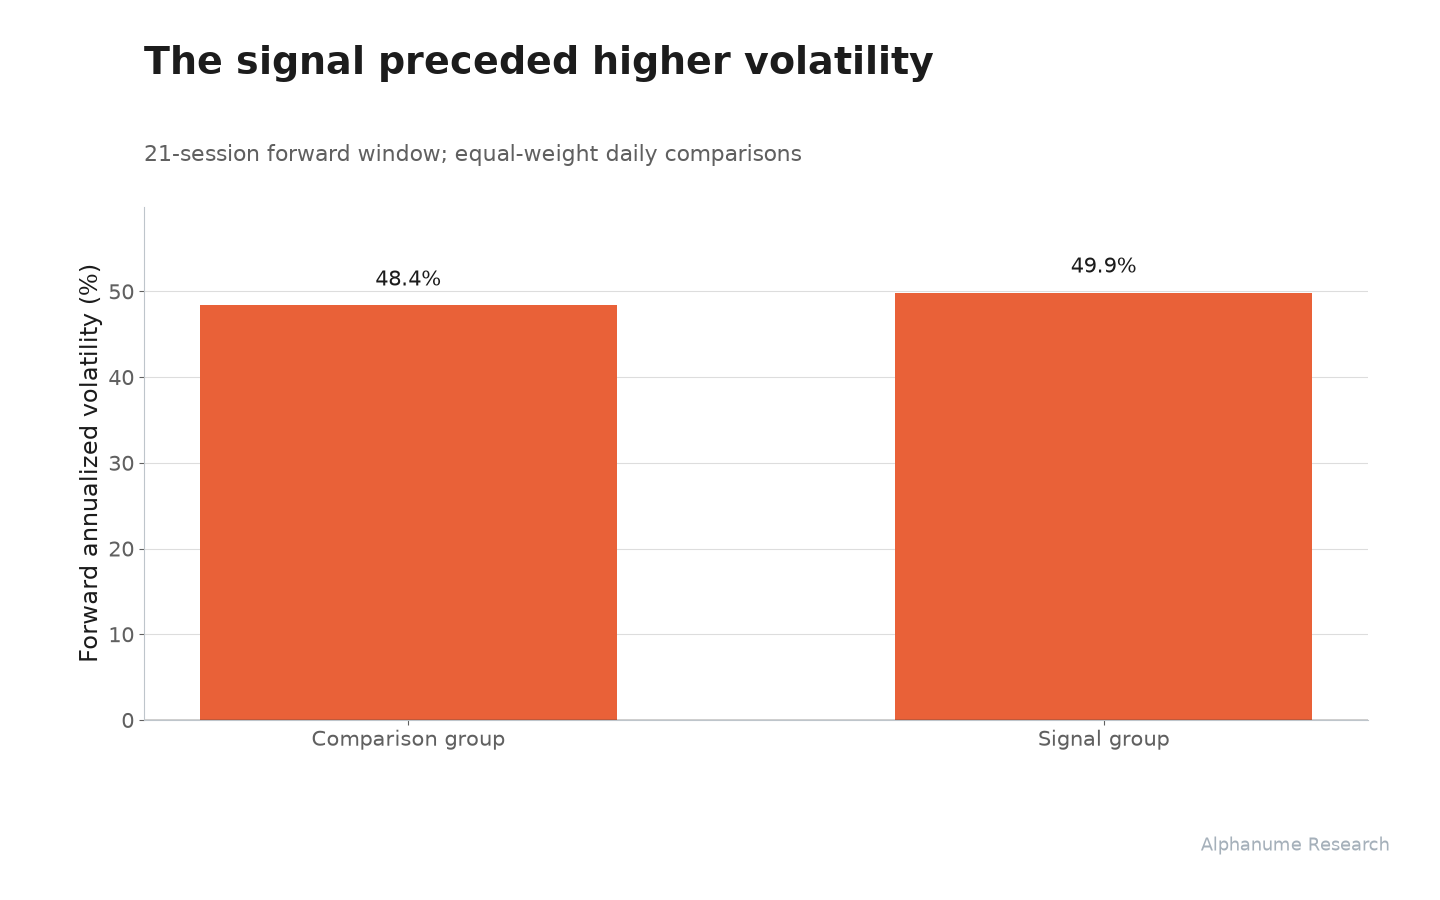
11.1The signal preceded higher volatility 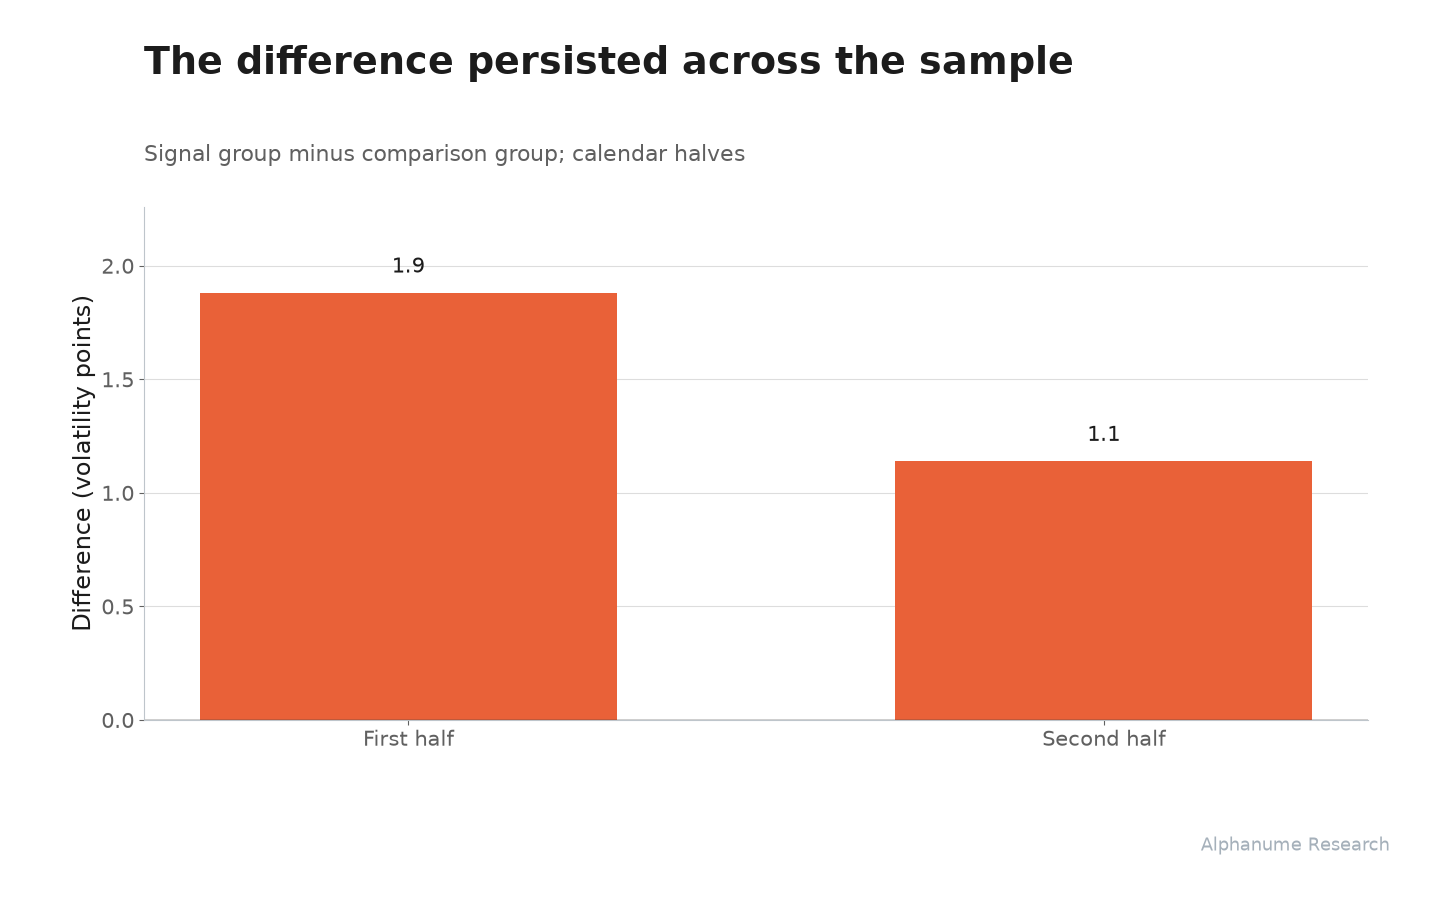
11.2The difference persisted across the sample
Study details
Attention spikes have a reported 30-day z-score of at least 2; comparison observations have scores below 1. Allow one full calendar day for publication, then enter at the next open. Keep the latest observation per ticker and entry session. Compare within the same date and trailing-volatility fifth.
Forward realized volatility uses returns from the next regular-session open through the 21st close, including intervening overnight returns and cash dividends; annualization uses 252 sessions. Observations require a complete price window. The t-stat tests the average daily group difference.
The reported t-stat tests the displayed mean against zero. Its 95% confidence interval is +0.47 to +2.56. Uncertainty uses 21-session calendar blocks; event samples also include an issuer-cluster variance allowance. The two calendar halves average +1.88 and +1.14 in the same units.
The evidence is on the page. The data is one query away.
Explore the events and signals behind these findings. Use the API to test your own filters, holding periods, and trading rules.